📝 Introduction
- FTX is a cryptocurrency exchange founded by Sam Bankman-Fried in 2019, who served as CEO until Nov. 11. The exchange issues its own token, FTT, and was the fourth-largest crypto exchange by volume as of Nov. 9.
- FTX and FTX.US crashed due to a lack of liquidity and mismanagement of funds, followed by a large volume of withdrawals from rattled investors. The value of FTX’s native token, FTT, plummeted, taking other coins down with it including Solana, Ethereum and Bitcoin, which reached a two-year low as of Nov. 9.
- The events that led to the collapse and bankruptcy of FTX started on November 2nd and these events continued until November 11th.
📃 Purposes of dashboard
The collapse of FTX caused a crash in the crypto market. Many projects in which FTX and its CEO ( Sam Bankman Fried (SBF)) were investors were affected. Solana was one of the projects that was severely affected by the collapse and bankruptcy of FTX. In this dashboard, we examine the impact of the collapse of FTX on the Solana network in various fields.
-
In the first step, we check the status of mined blocks and transactions. The metrics that are analyzed in this section are:
1️⃣ Number of Blocks Mined → Average Block Count
2️⃣ Total Fee per Day ($USD) → Average Fee (USD)
3️⃣ Success Rate per Day → Average Success Rate
4️⃣ Number of Transaction per Day → Average Transactions Count
5️⃣ Number of Transactions per Block → Average Transaction Count per Block
6️⃣ Number of New Wallets on Solana → Average Number of New Wallets
-
In the next step, the price of SOL and important tokens of Solana network are evaluated under the influence of FTX collapse. The metrics that are analyzed in this section are:
1️⃣ TOP 15 Tokens Average Price
2️⃣ Percentage of price change
-
Then the volume and number of transfers of SOL and stablecoins between different addresses are analyzed. The metrics that are analyzed in this section are:
1️⃣ Number of Transfers & Senders & Receivers → Average Number of Transfers/Senders/Receivers
2️⃣ Volume of SOL Transferred → Average Volume of SOL Transferred
3️⃣ Top 10 SOL Collectors During the Collapse
4️⃣ Classificatin of Transfers base on Volume($USD)
-
In the next step, the status of the Solana network swap in three time periods before, during and after the collapse of FTX will be investigated. The metrics that are analyzed in this section are:
1️⃣ Number of Unique Swappers → Average Swappers Count
2️⃣ Number of Swaps → Average Swaps Count
3️⃣ Volume of Swaps ($USD) → Average Swap Volume ($USD)
4️⃣ Number of New Swappers → Average Number of New Swappers
5️⃣ Swaps Value
6️⃣ Number of Sellers/buyers by Tokens
7️⃣ Number of "Swap from"/"Swap to" by Tokens
8️⃣ "Swap from"/"Swap to" Volume by Token ($USD)
9️⃣ Sales/Purchases Share of each Token
🔟 Average Swap Volume per DEX
-
Then the effect of FTX collapse on the staking and unstaking status of SOL currency is investigated. The metrics that are analyzed in this section are:
1️⃣ Number/volume of Events
2️⃣ Average Number of Staking/Unstaking
3️⃣ Average Volume of Staking/Unstaking ($USD)
4️⃣ Value of Staking/Unstaking Transactions
\
✍🏻 Methodology
-
In this dashboard, the following tables are used to extract data:
solana.core.fact_transactions→ Using this table, data such as the status of transactions and blocks of the Solana network, as well as the number of new wallets, were analyzed.solana.core.fact_token_prices_hourly→ Price analysissolana.core.fact_transfers→ SOL & Stablecoins Analysissolana.core.fact_swaps→ Swap Analysissolana.core.fact_stake_pool_actions→ Staking/Unstaking Analysis
-
Time frame considered in this dashboard → from the beginning of October 2022 onwards →
block_timestamp::date>='2022-10-01' -
In this dashboard, three time periods are considered:
1️⃣ Before the Collapse →
when date>='2022-10-01' and date<='2022-11-01' then 'Before the collapse'2️⃣ During the Collapse →
when date>='2022-11-02' and date<='2022-11-11' then 'During the collapse'3️⃣ After the Collapse →
when date>='2022-11-12' then 'After the collapse'
💡 Conclusion
At the beginning of November, with the publication of the financial balance sheet of FTX, the bankruptcy process of this large exchange began. This event affected the entire crypto market and many projects. The Solana ecosystem was also affected by the collapse of FTX. In this dashboard, we analyzed the impact of this event on the Solana network by dividing the time into three periods before the collapse, during the collapse and after the collapse of FTX.
The average percentage changes of the metrics reviewed in this dashboard are:


🖊 Observations
- Before the collapse of FTX, the number of mined blocks was increasing every day. But during the collapse, the number of mined blocks was decreasing. Finally, after the collapse of FTX, the number of mined blocks is gradually increasing.
- After the bankruptcy of FTX, the number of mined blocks of Solana network increased.
- During the collapse of FTX on November 9, the highest amount of fee was collected on the Solana network. In general, the fee collected on the Solana network increased significantly during the FTX bankruptcy. The reason for this is the significant increase in the number of transactions between November 2 and 11.
- The average daily fee collected on the Solana network decreased after the collapse of FTX.
- The highest and lowest transaction success rates in the considered time period were recorded on October 24 (86%) and November 9 (42%), respectively. The chart clearly shows that after the collapse of FTX, the success rate of transactions has decreased. The average daily success rate of Solana network before the collapse of FTX was equal to 81%, while after the bankruptcy of FTX, the success rate of transactions decreased to 67%.
- During the collapse of FTX, the average number of failed transactions increased significantly. After the collapse of FTX, the daily average number of failed transactions also increased.
- ✔ Before → 5.98M Failed TXs & 😱During → 11.6M Failed TXs & ❌After→ 9.4M Failed TXs
- During the collapse of FTX, the number of wallets that recorded their first transaction on the Solana network increased, but the number of wallets decreased after November 12. The average number of new wallets after the FTX collapse dropped from 206 wallets per day to 157 wallets per day.
🖊 Observations
- As a result of FTX's bankruptcy, the price of its native token, FTT, dropped from $26.47 on October 17 to $1.07 on November 28. That means, on average, the price of this token decreased by more than 95%. The beginning of the heavy decline in the price of FTT started on November 6 with a tweet from the CEO of Binance.
- The Percentage of price changes of the top Solana network tokens after the collapse of FTX is shown in the table below.
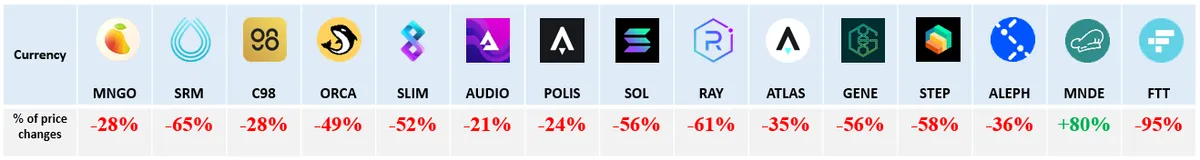
- Among the examined currencies, SRM and RAY tokens, which are the native tokens of Serum and Raydium DEXs, have had the largest price reduction.
About Serum
Serum is a decentralized exchange software built on Solana where cryptocurrencies can be bought and sold by traders. Project Serum will unveil a fully functional decentralized exchange with trustless cross-chain trading, all at the speed and price that customers want. And despite living natively on Solana, it will be interoperable with Ethereum.[1]
About Raydium
Raydium is an Automated Market Maker (AMM) and liquidity provider built on the Solana blockchain for the Serum Decentralized Exchange (DEX). Raydium has first-mover advantage as an AMM within Serum and it will be an integral part of bringing new and existing projects and protocols into the ecosystem.[2]
- SOL (native tokens of Solana blockchain) has decreased in price by about 56% after the collapse of FTX.
- Among all currencies, MNDE, the native token of the Marinade project, has recorded the best performance. After the collapse of FTX, this token has increased in price by an average of about 80%.
About Marinade
Marinade is a DAO that makes Solana even more censorship-resistant and composable through liquid staking. Marinade delegates staked SOL through a permissionless algorithmic delegation strategy to more than 400 validators to support the network's decentralization.[3]
- On average, the price of all Solana network currencies decreased by about 39% after the collapse of FTX.
🖊 Observations
- The daily average number of transfers, the number of unique senders and receivers of SOL decreased after the collapse of FTX compared to before. The changes of these parameters are:
- Transfers Count → Before → 2.751M & During → 2.66M & ❌After→ 1.754M
- Senders Count → Before → 123k & During → 103k & ❌After→ 77k
- Receivers Count → Before → 297k & During → 215k & ❌After→ 171k
- The volume of SOL transfers increased gradually from October 12 to November 8. The volume of SOL transferred between different addresses increased from 1.647B SOL on October 12th to 19.74B SOL on November 8th. But from November 9 onwards, the volume of SOL transferred between different addresses decreased, so that after the collapse of FTX, the daily average volume of SOL transferred between different addresses decreased by about 96%. On the other hand, the volume of SOL transferred between different addresses during the FTX collapse was higher than ever before.
- Volume of SOL Transferred → Before:7.228B SOL & 💥During:11.091B SOL & After:261M
- The address 5tzFkiKscXHK5ZXCGbXZxdw7gTjjD1mBwuoFbhUvuAi9 collected the most SOL during the FTX collapse.
- In all three time periods, the most SOL transfers were related to transactions with a value of less than $1. Only during the collapse, about 4% of the total number of transactions with a value of less than $1 decreased, although after November 12 the share of these transactions returned to the same as before the collapse of FTX.
- After the collapse of FTX, the share of transfers related to SOL with values between $1 and $10 increased by about 3%. Likewise, the share of transfers related to SOL with values between $1k and $10k decreased by about 2%. On the other hand, the share of SOL transfers with a value of more than $10K also decreased dramatically after the collapse of FTX.
🖊 Observations
- The number of sending and receiving addresses of stablecoins increased significantly between November 5 and 10.
- The number of unique senders of stablecoins on November 10 has recorded the highest amount.
- Since November 12th (after the collapse of FTX), the volume of transfers of stablecoins has decreased dramatically.
- During FTX collapse:
-
The address 7VHUFJHWu2CuExkJcJrzhQPJ2oygupTWkL2A2For4BmE net collected the most amount of stablecoins between November 2nd and 11th. (317M $USD)
-
The address 7VHUFJHWu2CuExkJcJrzhQPJ2oygupTWkL2A2For4BmE recorded the highest number of stablecoins sent (number of transactions). (19,808 posts)
-
The highest number of sending stablecoins to the address 3HixSznhPFXA8ueB2sy9iVmVCZP7McRSR4wUuCVeHfh4 was recorded.
-
- The percentage changes in the volume and number of transfers of each of the USDC, USDT, USDH and USDCET stablecoins after the collapse of FTX are shown in the table below.
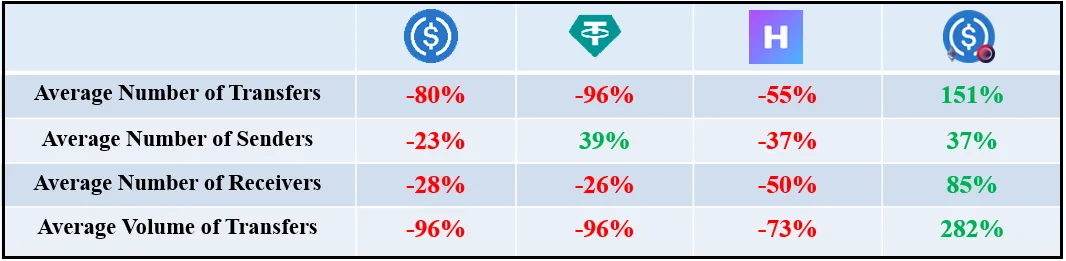
- Among all stablecoins, only the parameters related to USDCET have grown after the collapse of FTX, although the volume and number of transfers of USDCET are very small compared to other stablecoins. Of course, the number of USDT senders also increased by about 39% after the collapse of FTX.
- The volume of transfers of stablecoins such as USDC and USDT decreased by about 96% after the collapse of FTX.
🖊 Observations
- The number of swappers has grown during the collapse of FTX. So that on November 9, the number of swappers reached 27,571 users.
- On October 11th, there is a sudden jump in the number of Solana network swappers.
- The daily average number of swappers after the FTX collapse has decreased compared to before the event. (9446 users against 12252 users)
- From November 2 onwards, the number of swaps gradually increased, so that on November 10, the number of swaps reached its highest value. (589308 swaps)
- After the collapse of FTX, the number of swaps increased significantly. So that after the collapse of FTX, the daily average number of swaps has increased by 123%. (Before the collapse: 100k Swaps vs. After the collapse 223k Swaps)
- On November 8-10, the volume of swaps increased dramatically. Average daily swap volume on the Solana network during the FTX collapse was around $101M USD.
- The volume of swaps in the Solana network decreased by about 31% after the collapse of FTX.
- Contrary to the fact that since the beginning of October, the number of new swappers had a downward trend, but in the period from November 2 to November 11, the number of new swappers grew significantly, so that on November 9, the number of users who made their first swap reached the highest amount. It arrived from October onwards.
- On November 8-10, the volume of swaps increased dramatically. Average daily swap volume on the Solana network during the FTX collapse was around $101M USD.
- The volume of swaps in the Solana network decreased by about 31% after the collapse of FTX.
- Contrary to the fact that since the beginning of October, the number of new swappers had a downward trend, but in the period from November 2 to November 11, the number of new swappers grew significantly, So that the number of swappers reached 11.7k new users on November 9.
- In the time period before the collapse of FTX, most swaps had a value between 10 and 100 USD. During the collapse and bankruptcy of FTX, the largest share of swaps was for swaps with a value between 1 and 10 USD, but after November 12, the largest number of swaps registered by users are worth less than 1 USD.
🖊 Observations
- The largest volume of swaps in all three periods is related to USDC, SOL and USDT currencies.
- After the collapse of FTX, the sales share of USDC increased compared to before.
- 34.7%→42.41%
- After the collapse of FTX, the purchase share of USDC also increased compared to before.
- 40.4% →42.6
- After the collapse of FTX, the sales and purchase share of SOL and USDT decreased compared to before.
- Sales share → 29.8% →21.7%
- Purchase share → 27.1% → 21.3%
- After the bankruptcy of FTX, Jupiter's share in terms of swap volume increased dramatically among other exchanges. On the other hand, the share of Raydium and Orca DEXs in the swap volume decreased.
- Raydium → 23% →7%
- Orca → 9.9% →3.5%
- Jupiter → 64.1% → 86%
- The average daily swap volume in all DEXs decreased compared to before after the collapse of FTX.
- In all DEXs, the daily average swap volume during the FTX collapse is higher than at any other time. For example, on November 2-11, the average daily swap volume on Jupiter increased 5 times compared to before.
🖊 Observations
- Except eversol, the daily average number of staking and unstaking of users decreased after the collapse of FTX in all platforms.
- Among different staking platforms, Marinade project is in the first place and Lido is in the second place in terms of volume and number of staking.
- On November 10, during the collapse of FTX, the largest number of unstake transactions was recorded. Users withdrew a total of $26.3M USD from various platforms on this day.
- The average daily volume of staking and unstaking on all platforms decreased after the collapse of FTX.
- After the collapse of FTX, most transactions related to staking have a volume between $100 and $1000.
- A large number of user unstake transactions were worth less than $1 before the FTX bankruptcy.