Hop In the Pool
Trends Over Time
In this section, we examine the changes in how users join to liquidity pools over time. The graphs below examine the user join trend in terms of the number of pool join events. Also, the amount of tokens deposited into liquidity pools is presented in the following time chart in the weekly time frame. Normalized graphs are also displayed to show the ratio of the two types of joining to the pool.
Please check out this dashboard on twitter:
Tokens in Pool Joins
In this section, we examine the join to liquidity pools in terms of different tokens. The frequency of presence of each token in pool join events shows the popularity of that token among users. Also the amount of tokens deposited in join events is important. The graphs below show the number of pool join events as well as unique users partitioned by token. In order to make a better comparison, the volume of deposits to the liquidity pools has been drawn according to the value of the deposited token on the same day in USD.

Introduction
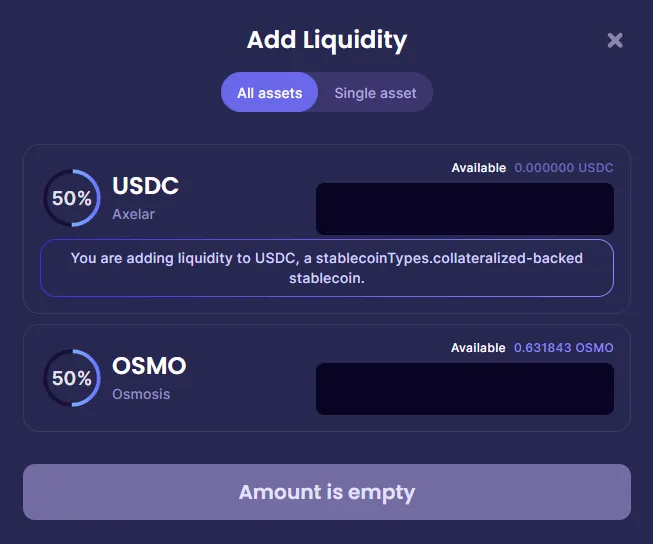
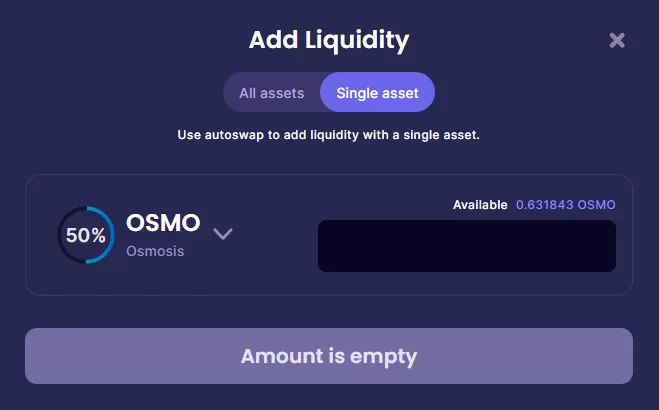
Each liquidity pool consists of a pair of tokens and has a balance of both tokens. Users can deposit to a liquidity pool in two ways. Either they make a deposit from both pool tokens (dive in headfirst) or they invest from only one of the tokens (wade in carefully). In this dashboard, we examine how users join liquidity pools in Osmosis in terms of volume and we study its trend over time. We also present the changes in the volume of swaps over time as a measurement on pool’s depth. We calculate the volume of swaps per token and introduce popular and profitable tokens in swaps.
Overview
In this section, we have an overview of how to connect users to osmosis liquidity pools. Our focus in this section is to have an overview of how users connect to liquidity pools. By separating the two defined types Single Asset and All Assets, we introduce the number of join events to the pool, the number of users who have joined, and the amount of tokens (in USD) entered into the pools totally. Please see the diagrams below.
Definitions
Osmosis
Osmosis is a proof of stake blockchain that serves as an automated market maker (AMM) protocol for the Cosmos ecosystem. AMMs are typically pools of digital assets managed by a smart contract used to enable decentralized trading. The liquidity pools and smart contracts replace the order book system; liquidity providers lock their assets into the pool and earn fees when people trade in these pools [+].
Liquidity Pool
A deposit of crypto tokens that an automated market maker (AMM) uses for trading on a decentralized exchange. Such pools provide the liqudity that enables people to connect their wallets to an exchange and swap one crypto token for another.
Liquidity Provider
Liquidity providers are investors who stake their cryptocurrency tokens on Liquidity Pools, therefoe DEXs can use it and Liwuidity Providers earn a share of transaction fees, often referred to as liquidity mining or market making.
Methodology
In order to get how users connect to liquidity pools, we use the osmosis.core.fact_liquidity_provider_actions table. In this table, with the action = 'pool_joined' criteria, we can find events related to connecting users to liquidity pools. If we have a connection event in a transaction with a specific transaction code, we conclude that the connection to the pool was a Single Asset type. If where were two events in a single transaction, the pool join is of All Assets type.
Swaps
Swap is considered as a transaction using liquidity pools. Swap transactions convert a certain amount of one token into its equivalent in another token. This possibility is provided by using liquidity pools, and the user who uses this possibility pays its fee. Liquidity providers benefit from fees in addition to swap platform creators. The larger the volume of swaps, the more welcome the liquidity pools are.
In this section, focusing on swap transactions, we measure the popularity and depth of users' use of liquidity pools. Below is the total volume of Osmosis swaps over time in terms of the USD value of the swapped tokens. Also, the total volume of swaps done for each destination token is also presented in order to find the best swap destination tokens.
Key Findings
- Osmo and Atom can be introduced as the most popular tokens in user investment in Osmosis liquidity pools.
- These two tokens have had the largest volume in joining to liquidity pools by users. In both of these tokens, the all-assets method of joining has been more popular in comparison to single-asset method. This is confirmed by the number of join events as well as the number of unique users who have joined with these two tokens.
- The single-asset method has been most welcomed by users in the NGM token. More than 45% of the deposits related to this token have been made by single-asset method.
- The least acceptance of the single-asset method by the users was related to the BCNA token. Only about 2% of the deposits related to this token have been made by single-asset method.

Key Findings
- The single-asset connection type was not active in the initial weeks of Osmosis liquidity pools, and after activation, it took some time for it to be known and used by users. It can be said that since December 2021, single-asset joining of users has been done actively.
- The trend of users using this new possibility has been upward and has surpassed the all-assets type in recent weeks. In recent weeks, more than 62% of users' joins have been done of this type. But still, the amounts deposited in this type of joining to liquidity pools are less in the recent weeks, despite the higher number of single-asset joins, their amount is less than all-assets and constitutes about 32% of the total amounts. This shows that users have invested in this way with smaller amounts.
Key Findings
-
Until today, more than 203 thousand unique users have joined Osmosis liquidity pools and have deposited tokens. More than 4 million pool join events have taken place, resulting in approximately 1500 billion USD being deposited into liquidity pools.
-
In general, users have been more accepting of joining to the pool of all-assets. It can be said that more than 60% of the join events were of the all-assets type. But single-asset events have a smaller volume because their volume raio is smaller than that of pairs of tokens. 13% of the total volume deposited into the pools were single-asset.
\

In addition, the trend of swaps over time in terms of the dollar value of the swap destination tokens is plotted in the chart below. The normalized equivalent of the graph is also provided.
Key Findings
- In two days of September 2021, we have had a very high volume of swaps, which indicates a special event in these days.
- Osmo and Atom have been the most popular swap destinations by users. In the next ranks, JUNO, LUM, CRO and SCRT can be introduced as the popular destination tokens of users.
- HUAHUA has been activated in January 2022 and has taken a significant share of the volume of swaps.
- The general trend of the volume of swaps has faced a clear decrease in recent months, which can be considered to be comparable in time to the long-term stagnation of the digital currency market.