Algorand Price Correlation
what is price correlation
Correlation is the degree to which the prices of different assets move together. If the prices move in a similar proportion and in the same direction, they have a high correlation. If they move in opposite directions, they have a high negative correlation. If the prices of different assets move in a way generally unrelated to each other, they have a low correlation. Correlation is usually measured across various asset classes like stocks, bonds, currencies, and commodities. It can also be measured with regard to securities of the same asset class, such as between two separate stocks. Correlation is typically calculated for a specific time period. Understanding the correlation of different assets is important in managing the level of risk in a portfolio — If the assets are all highly correlated with each other, the risk is greater.
EXAMPLE
Let's look at an example with two fictional companies. One is called Lead Corp, while the other is called Apex Tech. Over the last five days, Lead Corp's fictional stock has closed at:
- $200
- $195 ($5 drop)
- $197 ($2 rise)
- $202 ($5 rise)
- $204 ($2 rise)
Whereas, Apex Tech's stock has closed at:
-
$100
-
$110 ($10 rise)
-
$115 ($5 rise)
-
$112 ($3 drop)
-
$110 ($2 drop)
\
As you can see, the stock prices of the two company’s don’t appear to be moving in tandem –- This means that two stocks had a low correlation — or even a negative correlation — over those five days. Only performing some mathematical calculations could confirm which it is.
> ## Almost no diversification > > \
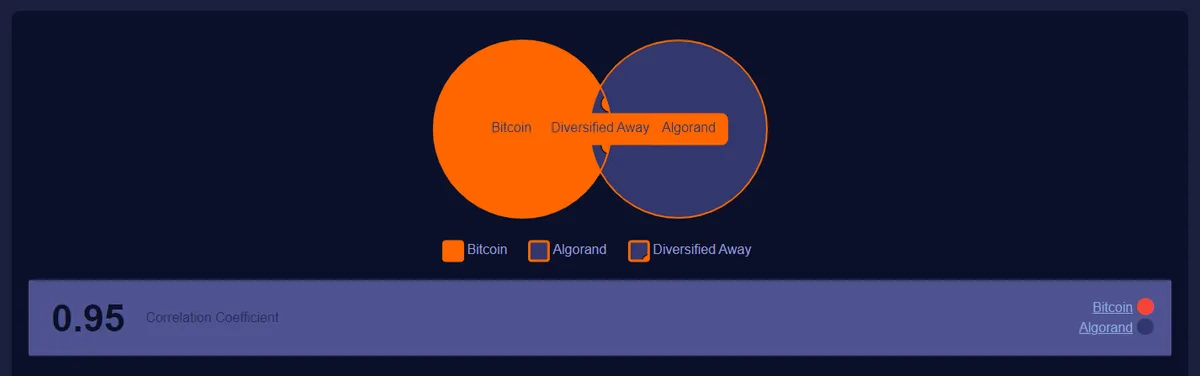
The 3 months correlation between Bitcoin and Algorand is 0.95. Overlapping area represents the amount of risk that can be diversified away by holding Bitcoin and Algorand in the same portfolio, assuming nothing else is changed. The correlation between historical prices or returns on Algorand and Bitcoin is a relative statistical measure of the degree to which these equity instruments tend to move together. The correlation coefficient measures the extent to which returns on Bitcoin are associated (or correlated) with Algorand. Values of the correlation coefficient range from -1 to +1, where. The correlation of zero (0) is possible when the price movement of Algorand has no effect on the direction of Bitcoin i.e., Bitcoin and Algorand go up and down completely randomly.
> ## Almost no diversification
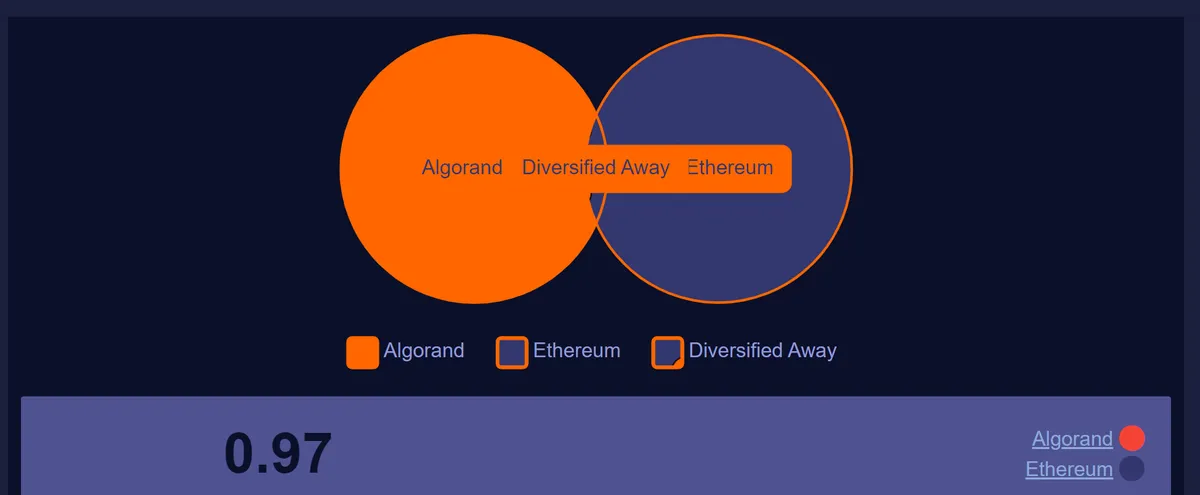
The 3 months correlation between Algorand and Ethereum is 0.97. Overlapping area represents the amount of risk that can be diversified away by holding Algorand and Ethereum in the same portfolio, assuming nothing else is changed. The correlation between historical prices or returns on Ethereum and Algorand is a relative statistical measure of the degree to which these equity instruments tend to move together. The correlation coefficient measures the extent to which returns on Algorand are associated (or correlated) with Ethereum. Values of the correlation coefficient range from -1 to +1, where. The correlation of zero (0) is possible when the price movement of Ethereum has no effect on the direction of Algorand i.e., Algorand and Ethereum go up and down completely randomly.
> ## Almost no diversification
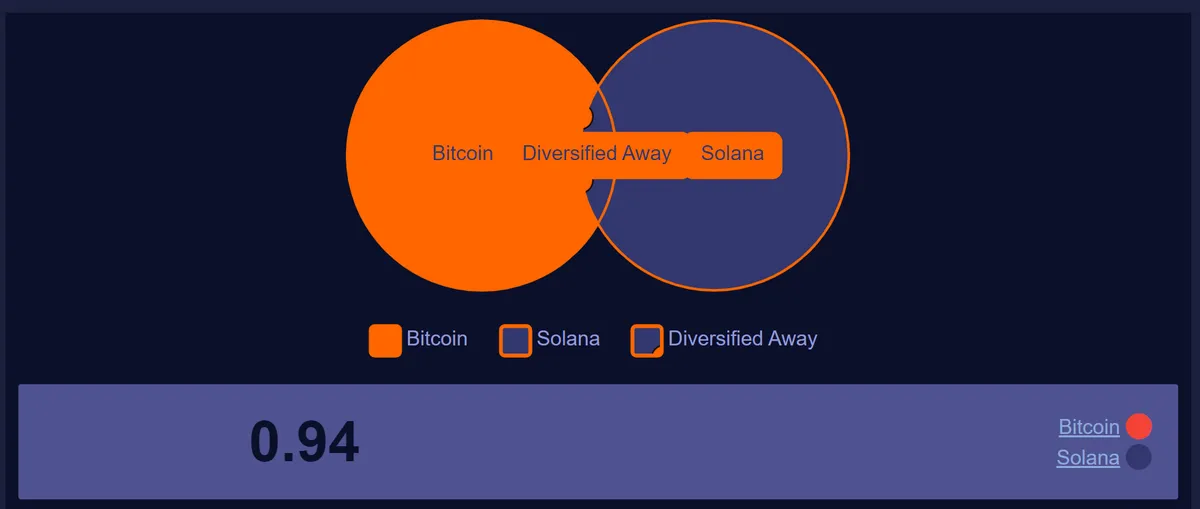
The 3 months correlation between Bitcoin and Solana is 0.94. Overlapping area represents the amount of risk that can be diversified away by holding Bitcoin and Solana in the same portfolio, assuming nothing else is changed. The correlation between historical prices or returns on Solana and Bitcoin is a relative statistical measure of the degree to which these equity instruments tend to move together. The correlation coefficient measures the extent to which returns on Bitcoin are associated (or correlated) with Solana. Values of the correlation coefficient range from -1 to +1, where. The correlation of zero (0) is possible when the price movement of Solana has no effect on the direction of Bitcoin i.e., Bitcoin and Solana go up and down completely randomly.