On December 7, 2020, Silvio Micali, the founder of Algorand, made a bold announcement:
> Algorand will enjoy about 46,000 finalized Transactions Per Second in 2021.¹
> -Silvio Micali, Algorand founder, December 07, 2020.
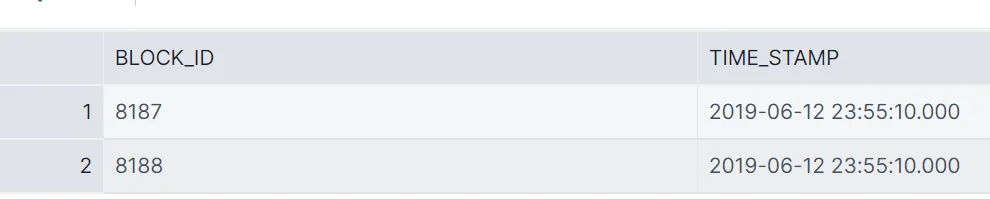
Let's look at few outlier events when block performance was outside the norm. My apologies for the tables with invalid timestamps. Right below the affected tables you will find a screenshot with all the data.
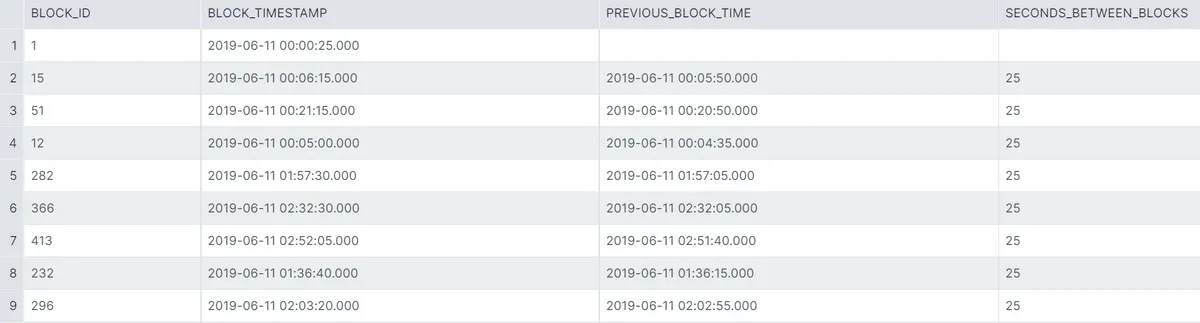
On June 11, 2019, Algorand emitted block number 1. At that time and for a few days afterwards, blocks were emitted every 25 seconds. The graph above ignores those first few days of data. This is to achieve a line chart with a consistent scale.
The chart shows the daily average number of seconds between blocks. It was calculated by dividing the number of seconds in a day by the number of blocks emitted per day.
Slow Blocks
There are plenty of blocks with a 25 second delay between them. These are the 'slowest' blocks.
The early blocks were all slow for a few days, but even after then there were other times where 25 seconds elapsed between blocks.
Blocks contain transactions that are validated by the nodes and then registered on the public ledger. This process occurs every 4.4 seconds and constitutes a chain of blocks.
The block with the all-time highest number of transactions was emitted on December 01, 2021.
The average number of transactions per block has kept increasing. There was an inflection point in July 2020 when the average went from 2 to 20 transactions per block.
We can't talk about blockchain performance without measuring transactions per second. Let's see if Algorand's objective of achieving 46,000 transactions per second was achieved.
Algorand was launched in June 2019 by Silvio Micali, a professor at MIT and recipient of the prestigious Turing award. Algorand is often described as the first true Proof of Stake blockchain.
The blockchain is not only carbon-neutral, but it has also vowed to become carbon negative². From a technical perspective, the blockchain promises fast transactions, a reliable network and a large throughput. Algorand's goal of achieving 46,000 transactions per second (TPS) would vastly surpass Solana's 1,753 TPS and Ethereum's current TPS ³ of around 13.
Let's look at the performance of Algorand. We will focus mostly on block performance.
In his 2020 blog post, Silvio explains the difference between the emission of new blocks and the finalization of blocks. He stresses the importance of calculating throughput based on the finalized blocks. Blocks on Algorand are proposed every 0.5 seconds. However, not all these blocks get finalized. It takes about 4.5 seconds to recover from an unsuccessful block proposal. Time between finalized blocks is the true measure of block performance.
Back on the chart above, we measure consistent and fast block performance. In my understanding, the variability in times between blocks is explained by the occasional unsuccessful block proposals.
Fast Blocks
We also find periods with 0 seconds between blocks. I don't think this is possible. After reading Mr. Micali's post which I linked in my sources below, I am inclined to think that the actual time elapsed between blocks is at a minimum 0.5 seconds. Perhaps my dataset does not register timestamps in such small increments and instead displays it as 0 seconds.
This big block contained 4,998 transactions.
Most of these transactions were payments, with a few asset transfers.
Amongst the assets transferred, we find the suspicious LC Blitz Ranking. In my previous post on Algorand assets, I uncovered millions of transactions originating from LC Blitz Ranking (and LC Rapid Ranking). These assets were only ever held by a few different addresses. I hypothesize that LC Blitz Ranking is continuously being transferred from one address to another, at a rapid pace, possibly for the sole purpose of rising in the rankings of assets on Algorand.
The daily average number of transactions per second appears far lower than 46,000. One possibility comes to mind:
- The 46,000 TPS may be a theoretical limit that has not yet been stress tested. After all, the real-world demand for transactions is not infinite.
There was a spike in transactions on March 23, 2021. We can observe how Algorand performed on that day.
This line chart shows the approximate transactions per seconds achieved on March 23, 2021. The exact number of TPS is hard to calculate. As we have seen earlier, some blocks are finalized every 25 seconds while others require only 0.5 second. This makes it more challenging to get a second-by-second measurement of TPS.
In any case, March 23 was a good stress test of Algorand's performance. On that day it repeatedly achieved more than 1,000 TPS and even went above 2,000 once.
Algorand has one of the highest throughputs of any blockchain.
- The average time between blocks is 4.4 seconds.
- There are times when 25 seconds elapse between blocks. At other times, blocks are emitted in less than a second. The variability is because once in a while some proposed blocks are not finalized. When this happens, Algorand needs a bit of time to recover.
- In the last few weeks, the average block included around 100 transactions.
- The all-time largest block included 4,998 transactions.
I was not able to verify Algorand's claim of achieving 46,000 transactions per second. It could be that the 46,000 TPS capability is a theoretical limit that has not yet been stress tested.
Algorand has delivered outstanding performance with TPS peaks surpassing 1,000 and even 2,000. This is much higher than Ethereum's average of 13 TPS.
Algorand offers great speed, reliability, and vast throughput. I will follow its usage and adoption closely.
Real-time TPS data can be found on metrics.algorand.org. The performance indicated on that website is in line with the line chart produced above.