Sushiswap Pools - Gainers and Losers
In this post I compare daily changes in metrics for the different liquidity pools on Sushiswap. I highlight the biggest gainers and losers measured based on the following:
- Changes in fees collected,
- Changes in swap volume, and
- Changes in total liquidity of the pool.
The charts above show the biggest gainers and losers in terms of total liquidity. I am perplexed to see some liquidity pools appear in both datasets. I suspect there may be something wrong with my query.
I have more confidence in the accuracy of these subsequent queries.
Swap volumes and fees are tightly linked. Fees represent 0.3% of swap volumes. For this reason, ranking based on volume is the same as ranking based on fees. Rankings between these two variables would differ if we were looking at the percentage variation instead of the absolute variation in total amounts.
Changes indicate the variation of each metric on a 24 hour basis.
The total liquidity is the amount of tokens pooled by liquidity providers.
Swap volumes indicate the amount of trading between the token pairs.
Fees collected represent 0.03% of swap volumes.
All amounts are converted to USD.

The daily variation in total liquidity can surpass $10M for some pairs.
Limitation: Sushiswap is available on both Ethereum and Polygon. This post only looks at Ethereum data.
Note: In order to save on bandwidth, daily refreshes will be turned off sometime in February.
- Daily variations in liquidity can surpass $10M for some pairs.
At time of writing:
- the pairs with the highest 24h variation (up or down) in liquidity were: Mana-Eth, Punk-Eth, Ohm-Dai and Ohm-Eth;
- the pairs with the highest 24h increase in transaction volume and fees were: Ohm-Dai, USDC-Eth and Ohm-Eth;
- the pairs with the highest 24h decrease in transaction volume and fees were: Eth-DPX, Lon-USDT and Eth-CRV.
These stats are also shown on analytics.sushi.com .

How about Sushiswap the platform? Is it gaining or losing popularity against the incumbent Uniswap?
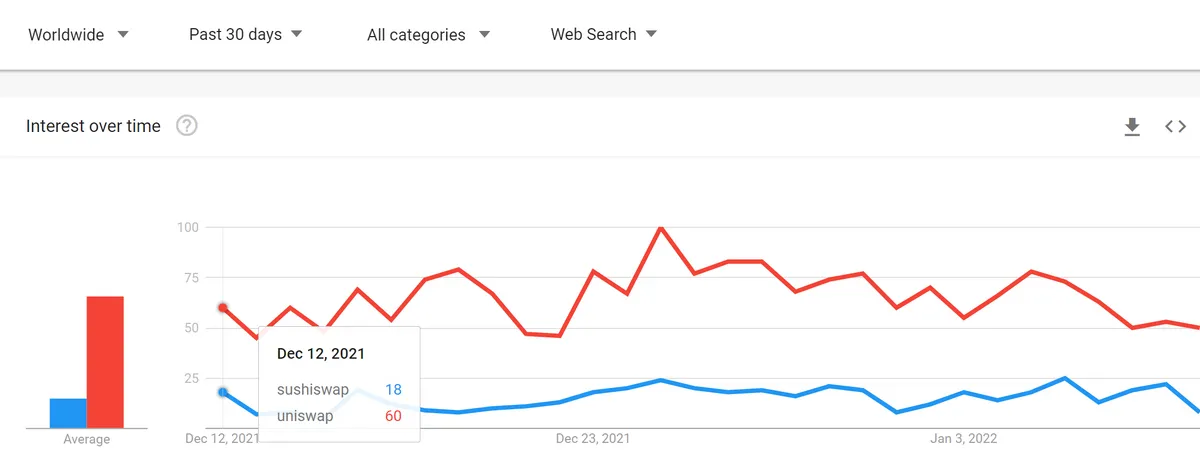
Kartod#2092 has already done a great job comparing trade volumes on Sushiswap vs Uniswap. In this section I compare the evolution of Google Search interest for the terms 'Sushiswap' and 'Uniswap'.
The relative share of search interest for Sushiswap and Uniswap is similar to what it was thirty days ago.
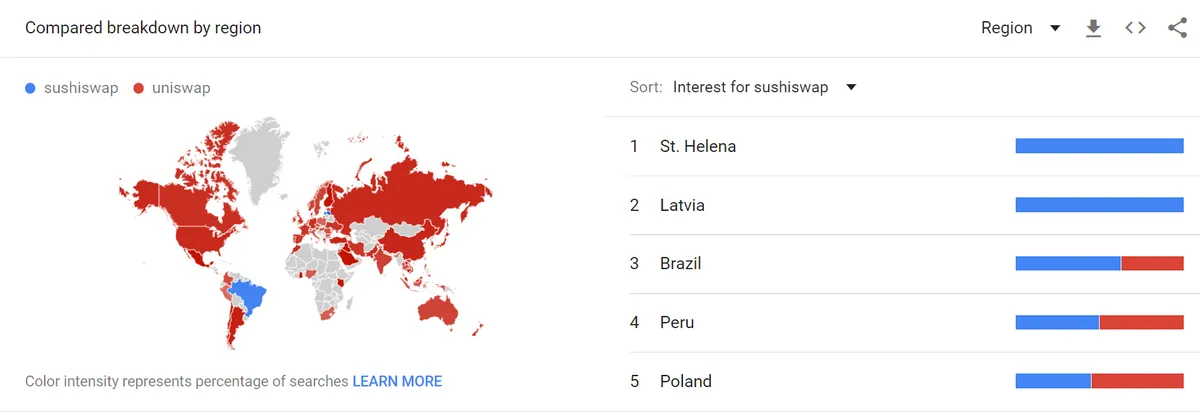
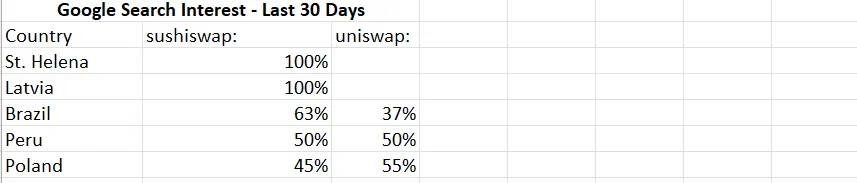
On a global basis, Sushiswap represents ~20% of search interest when compared to the more popular Uniswap. However, on a country by country basis some regions stand out.
I wonder why Sushiswap is more popular is certain countries. Could Sushiswap adapt its marketing strategy to take advantage of its increased popularity in certain regions?
Thank you for reading. 🍣