Address Tagging in Thorchain
What are the various clusters of behavior among THORChain addresses? One cluster we would expect to see would be arbitrage bot addresses, will be there?
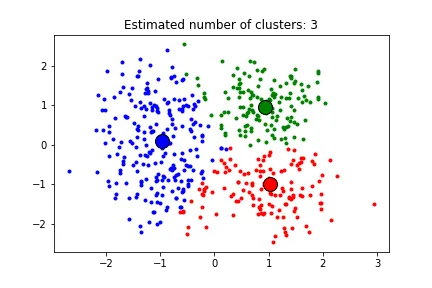
My second analysis was done with a K-nearest neighbor algorithm, to find the closest people among users because they should be users with the same characteristics. In this case, 3 estimated clusters appeared. Why? because users with most swaps and users with more fees usually are correlated, so this model looks like detects this as the same group.
Below you can see as well the basic statistics I found in terms of clustering the table above are:
- Estimated number of clusters: 3
- Homogeneity: 0.859
- Completeness: 0.839
- V-measure: 0.822
- Adjusted Rand Index: 0.871
- Adjusted Mutual Information: 0.837
- Silhouette Coefficient: 0.725
Introduction and methods
THORCHain is a decentralized liquidity protocol that allows users to easily exchange cryptocurrency assets across a range of networks without losing full custody of their assets in the process.
With THORChain, users can simply swap one asset for another in a permissionless setting, without needing to rely on order books to source liquidity. Instead, market prices are maintained through the ratio of assets in a pool.
As in many other blockchains, the behavior is different among users. However, there are some of them that show similar activities.
The main goal of this analysis is to find various cluters among THORChain addresses based on its behavior. We will focus in getting a cluster related to bot arbitrage addresses.
Note: I have taken into account different tables to be able to see some patterns and to find some clusters: thorchain.swaps, thorchain.transfers, thorchain.liquidity_actions and thorchain.fee_events
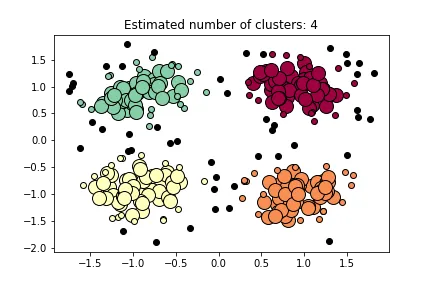
However, I went further to obtain more detailed information and to find some other clusters or corroborate types of groups inside Thorchain network. So, into the next experiment, I added bubbles into my plot as well as some other characteristics to determine and separate better each cluster, marking in black the noise samples.
Again, 4 subgroups were detected. Similar to the first chart, it seems that the groups are the same.
The basic statistics I found in terms of clustering the table above are:
- Estimated number of clusters: 4
- Estimated number of noise points: 87
- Homogeneity: 0.849
- Completeness: 0.735
- V-measure: 0.788
- Adjusted Rand Index: 0.762
- Adjusted Mutual Information: 0.785
- Silhouette Coefficient: 0.490
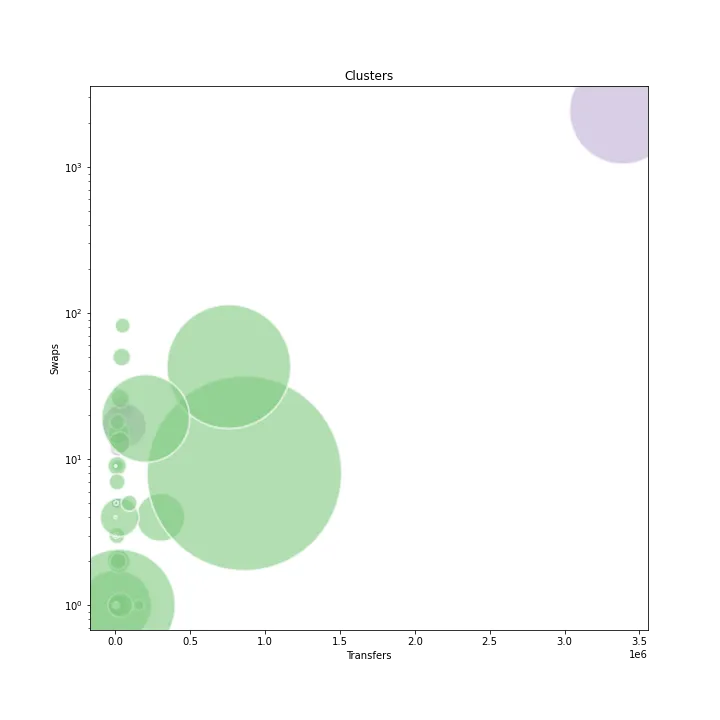
Furthermore, in order to demonstrate that the possible clusters found are correct or exist, I made other plots to combine the results. In the following charts, you can see the different groups obtained by the number of swaps vs the number of transfers. Here we can see something different!
-
Looking at the first graph, the major of the users are situated at the bottom-left of the chart, showing few swaps and transfers or basically few transfers but some more swaps. Here, we can detect 2 different types (those who swap and transfer as few times as he/she can, or those who like to do swaps jeje). But, another group appeared at the top-right, which is completely on the opposite side of the rest of the users. Why? Mmmmm I think we detect the bots group! the differences in terms of swaps and transfers are there, how is it possible that some humans do these numbers of transactions and swaps... not possible.
-
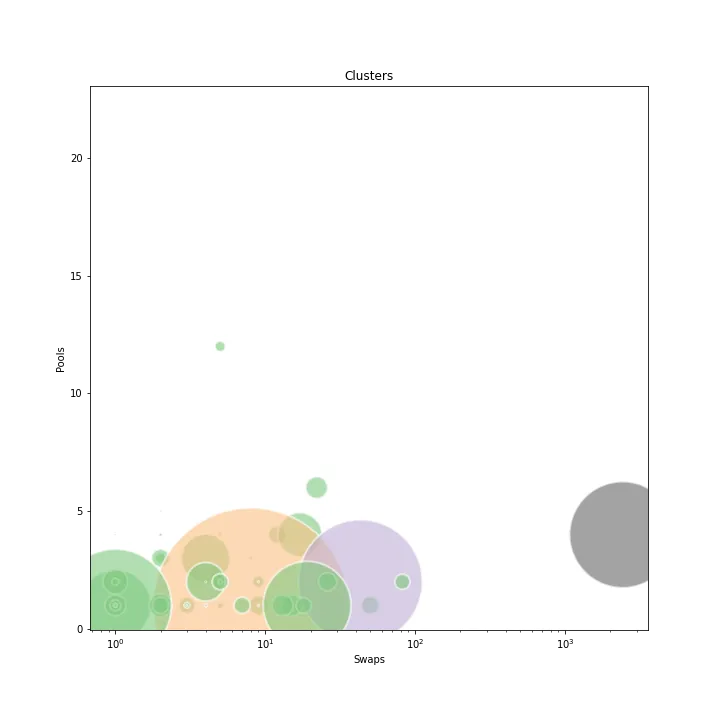
If we take a look at the second chart, we can see the users grouped by the number of swaps again but taking into account the number of pools to which they add liquidity as well. Why? To see if the previous group called "bots" are bots or not. And... yes, we can see how again, a similar number of users appeared at the other side of the chart. Now, saying that there are some "users" that are doing a lot of swaps but always join (if join) few pools.
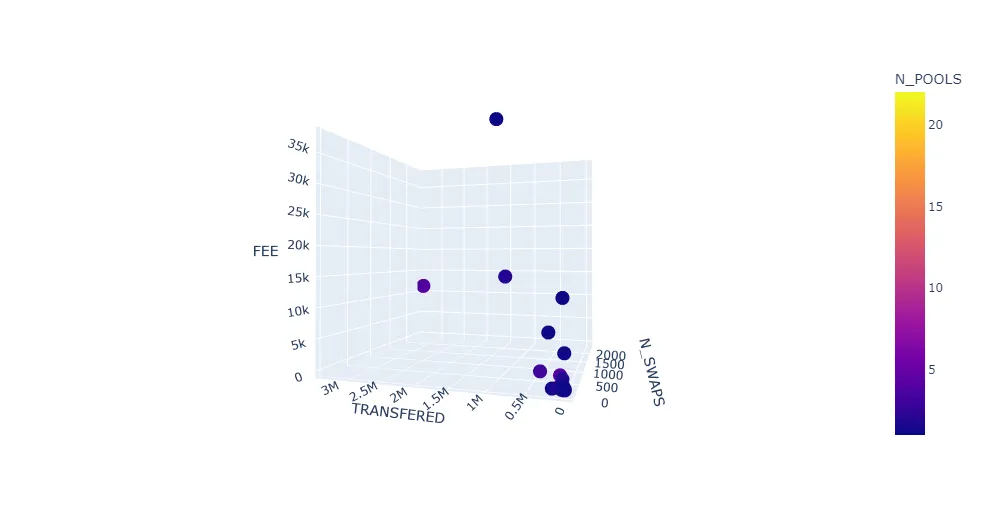
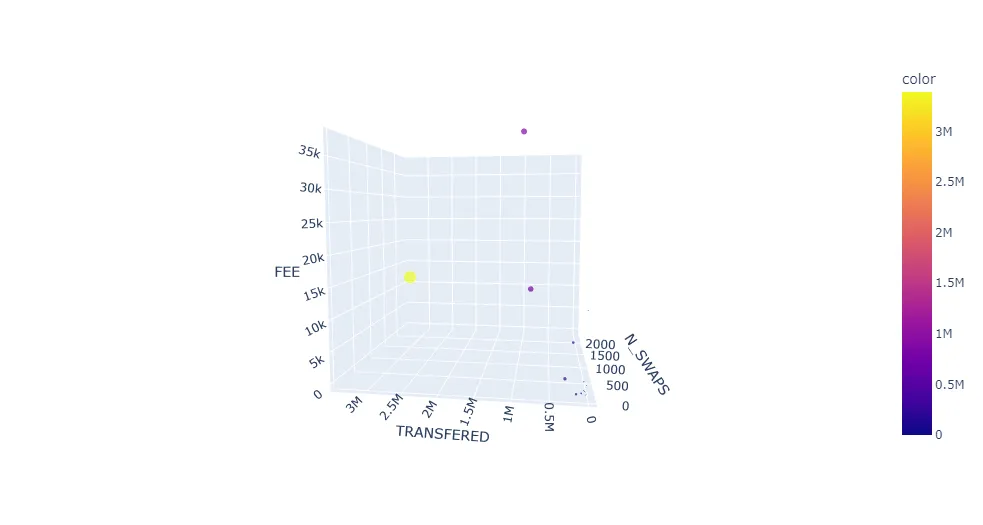
To mesh the previous 2 charts in one and see the global analysis, I did some 3D charts, where we can see the different patterns as well.
Here we can see again the islet group of bots. Here, we can see the fees that are paid, which is similar for those who do not do so many swaps, it could be because they are doing massive transfers and do not pay so much on average.
Thanks to previous data, I could generate a model to predict possible patterns and make some subgroups (clusters) that could be visible inside Thorchain users.
First of all, as shown in the image below, I have analyzed with Python scikit-learn tool some possible clusters taking into account the whole data and 4 estimated clusters appeared. For sure, we cannot assess automatically what thype of users are there, but it is to say that it seems the programme take litteraly each type of data like users who did most swaps, users who spent most in fees, etc. For this reason, I procedeed with more sophisticated manners.
Conclusion
In this post, we have studied some different type of users exploring Thorchain: those who try to do s many operations as possible to avoid to pay fees, thosw who don't matter the fees and do a lot of transactions, those who are superactive and pay the same fees as the same group, as well as those who are too active to be a human person... There are a lot of scams inside the world of cryptocurrencies, but also there are a lot of bots and machines that are running with "similar purposes". We need to avoid that if we want to see that fantastic world succeed. We can push harder to avoid all of these types of things.
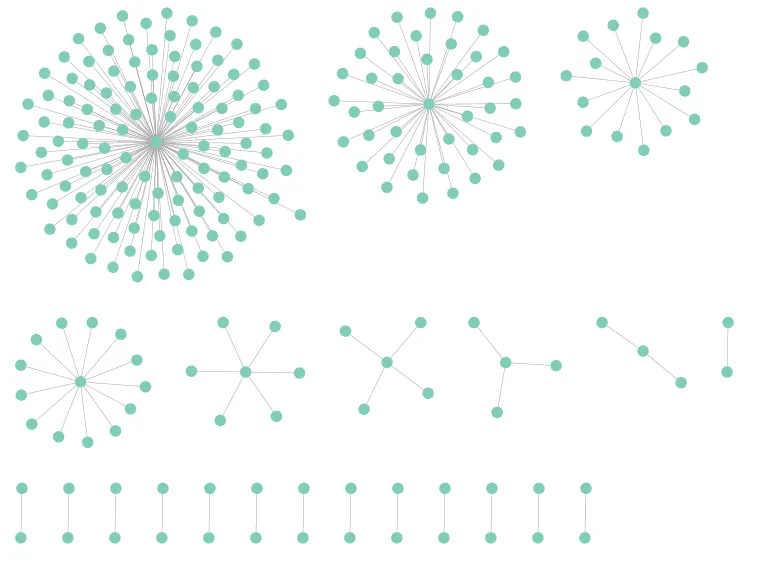
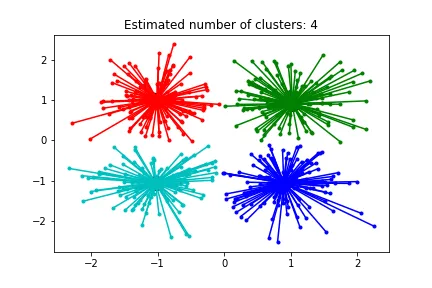
To finish the analysis, I used the data as a network and I generated a possible virtual network of the users. In this case, the number of clusters is higher, because it selects each of several cases and does not merge any non-related character. The characteristics of the different graphs are:
- For the bigger one (representing the larger group): Those who had made some transaction and paid the corresponding fees
- The second larger group, which correspond to those who made some transaction but did not pay any fees (could be possible if they receive money but don't do any swap or transfer)
- The third group is about those who do a lot of transactions, too many transactions...
- Then those who have poor numbers in general
- Then those who have a lot of transactions but fewer fees than expected
- The next group are similar to the previous one but with higher fees than expected
- The rest of the group are non-related users that the programme was not able to categorize.