Polygon Fees
Introduction and methods
Polygon (MATIC) is a scalability project that allows decentralised applications to run on a network with lower fees, higher speed and interoperability with the Ethereum network.
The Polygon (MATIC) project proposes an improvement in security by moving to Proof-of-Stake (PoS) consensus. Improving the user experience through a much more intuitive interface. It also seeks to offer native mobile apps and a software development kit that supports WalletConnect. It also proposes a Blockchain that can support different types of protocols and consensuses, and solve the scalability problem, adding greater capacity to process transactions per second, lowering transaction fees and ensuring security. Polygon also implements interoperability between sidechains, allowing the exchange of data and assets between different blockchains.
In this dashboard we are gonna visualize the transaction fees on Polygon since July 3rd 2022 because of there is some missing/wrong data on July 2nd. The intention is to compare the Polygin fees against the fees on Ethereum over the same time period. The final goal is to find some correlation or divergence between the trends.
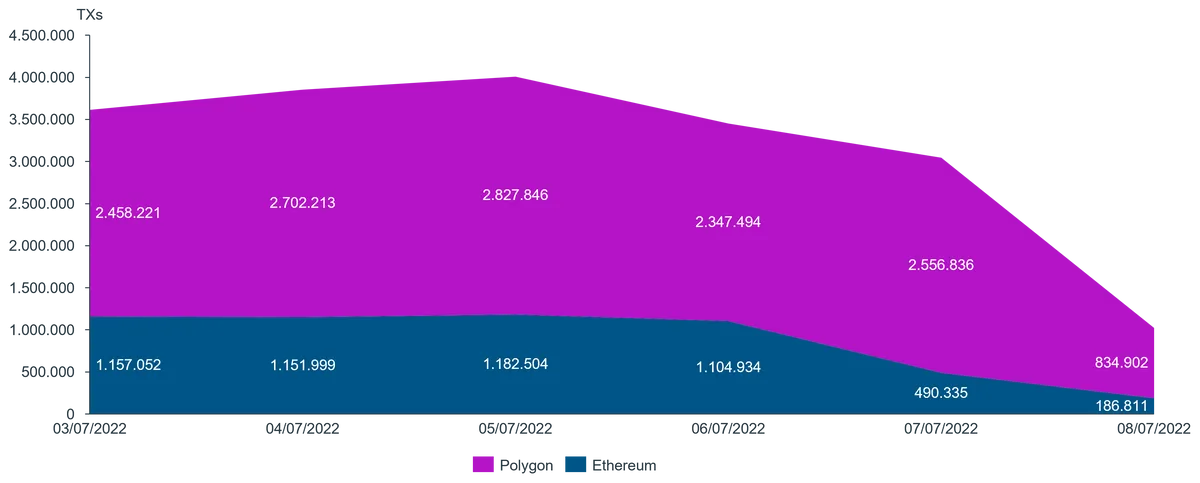
As we can see in these two graphs, the Polygon network has more transactions than the Ethereum network. Approximately, Polygon has more than twice as many transactions as Ethereum. In terms of trends, we can say that Ethereum transactions have started to decrease since July 6th until today. In contrast, Polygon's transactions have dropped a day earlier.
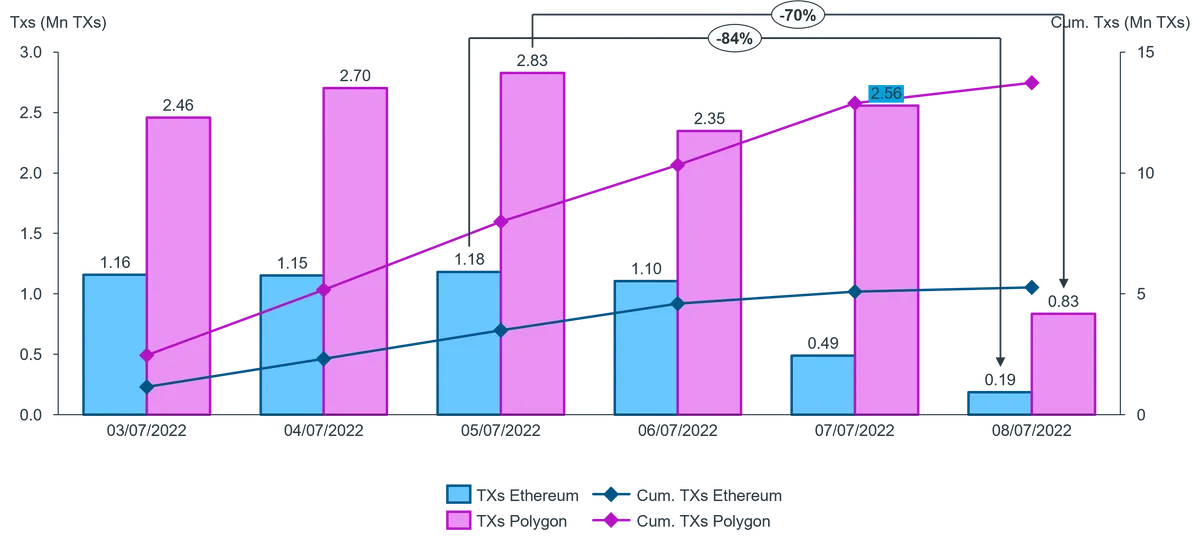
From the day when Polygon and Ethereum had their best transaction data until today, July 8, which has been their worst transaction data, they have decreased by 70% and 84% respectively.
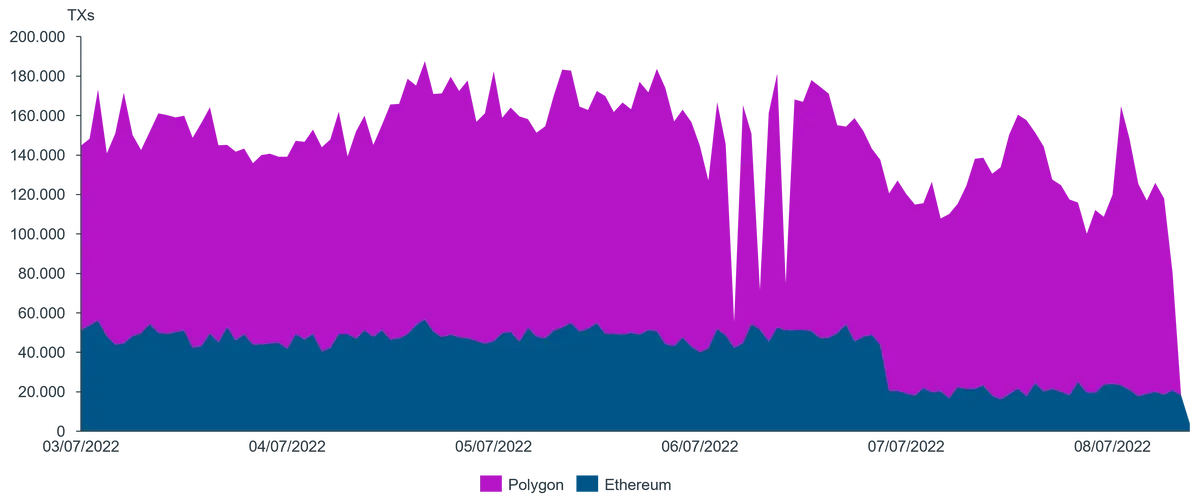
Finally, we can appreciate that, in terms of transactions per hours, the decline of Polygon's network does so with a wave trend. In contrast, Ethereum's decline is more abrupt and sudden.
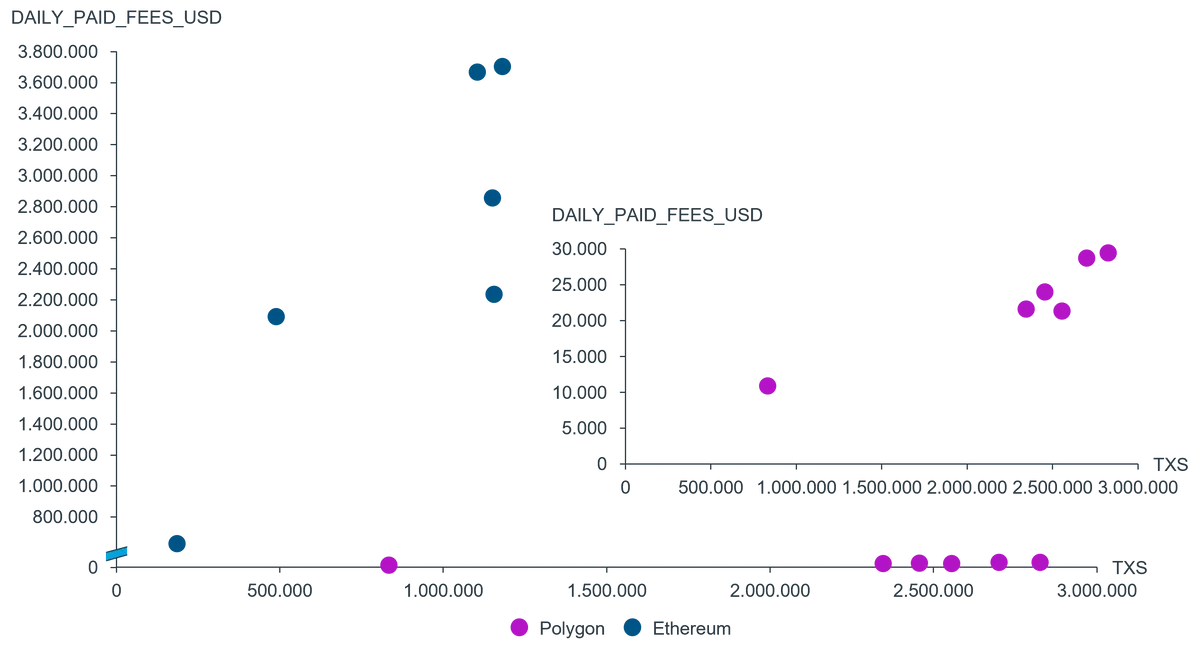
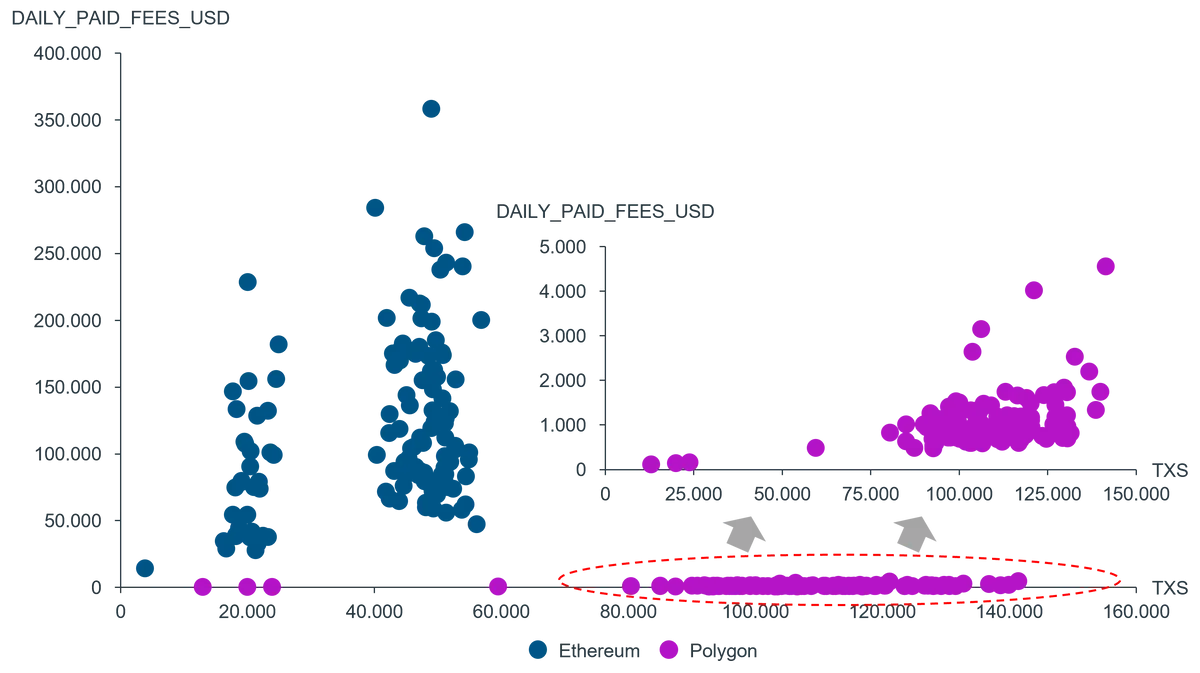
In these two graphs we can see the correlation between Polygon and Ethereum fees and transactions. As we have analyzed, the points of the Ethereum charts are more to the left, this means that the fees are quite expensive. On the other hand, in the case of Polygon's charts, the dots are further to the right, which means that the transaction fees are much cheaper than those of Ethereum.
\n
Conclusions and key insights
In this dashboard we have analyzed the Polygon fees in several metrics and we have compared it with Ethereum numbers. The main insights extracted from the analysis have been the following:
- Polygon network has more transactions than the Ethereum network, more than twice.
- Ethereum transactions have started to decrease since July 6th until today.
- Polygon's transactions have dropped a day earlier.
- In transactions per hours, the decline of Polygon's network has a wave trend. Ethereum's decline is more abrupt.
- The fees are more expensive in Ethereum than Polygon.
Finally analyzing the average transaction fee per hour and day it can be seen how the trends are similar but the fees are so different being the Polygon cheaper than Ethereum.