Terra Governance Grind
Fueled by a passionate community and deep developer talent pool, the Terra blockchain is fully community-owned and built to enable the next generation of Web3 products and services [1].
In Terra, users can stake their LUNA to vote on governance proposals. The users with higher amount of holdings have more power in the voting system. The validators network on Terra is a vital part of the ecosystem and, among other things, guarantees the security of the Proof Of Stake blockchain. You're probably wondering, how so? Think of a validator like a banker or, even better, like a Bitcoin or Ethereum miner. They are responsible for authoring transactions and make sure to only add valid and non-tampered transactions to a block on the blockchain. Moreso, they are also required to regularly cast votes for the prices of LUNA tokens. Misbehaviors get punished by slashing a validator. This translates to a loss of funds (including delegators' LUNA) equal to the gravity of the offense.
Validator candidates can bond their own LUNA and have LUNA "delegated", or staked, to them by token holders. The validators are determined by who has the most stake delegated to them — the top XX validator candidates with the most stake will become LUNA validators (depending on the proposal approved).
In this dashboard we are gonna explore how the proposals are being voted in the Terra ecosystem. Mainly, we are gonna focus on the five last Props 3619, 3665, 3794, 3795 & 3796.
In the first approach, we are gonna compare the main voting activity over these five proposals. The main metrics to be compared are:
- Daily votes and active voters per proposal
- Average votes per voter on each proposal
- New vs old voters activity
On a second approach, we are gonna track several governance metrics to see if the proposals had some effect on the Terra governance:
-
How did the voting power of the top 66% of the active set validators change after these proposals were passed?
-
Power share distribution by validators rank
-
How did the Nakamoto Coefficient change after these proposals were passed?
\
Finally, we are gonna compare two of the most interesting proposals: 3795 and 3796 in order to see what happened with them and why. \n
How these proposals affected on Terra governance?
- In the analysis above we have considered the two last proposals on Terra, one about a Terra Poker Grant and the other one about Eris Protocol Grant. It has been analyzed not only the voting activity, but also the proposal results as well as the community feelings in each case.
- While the Terra Poker proposal had more activity during the first day than the second one, it seems that for the rest of the days, the second proposal had more activity than the first one. So, looking at the cumulative charts, we can see how more votes were casted on the proposal 3796 than in 3795.
- For the proposal 3795, more than 60% of votes were ‘No’, 31% ‘Yes’, 5.5% ‘Abstain’ and less than 3% for ‘Veto’. Quite different from the proposal 3796 in which ‘Yes’ represented more than 64% of the total votes, ‘No’ less than 24%, Abstain 10% and ‘Veto’ less than 1.5%.
- The percentage of new validators can clearly seen that increased on proposal 3796, being 25% for the first proposal and more than 30% for the second proposal.
- The results show that Terra Poker Protocol Grant Proposal has failed while Eris Protocol Grant Proposal has passed. The main reasons are:
- Terra Poker intention is basically to raise funds to continue the project, without giving any concrete details of where the money will go and how it will contribute to the Terra ecosystem and its community, while Eris Protocol has the intention to continue the project’s roadmap and return 10% of the capital to Terra governance community.
- Terra Poker previously raised money from a token sale launched at Valkyrie, while Eris Protocol has not carried out any token sale.
Looking at the voting power of the top 66% of the validators after these proposals were voted, we can see how during the first two proposals (3619 and 3665) the voting pwoer of top 66% of validators keep growing fast, from 112.3M to almost 113M.
This trend continue with proposal 3794 and 3794 but suddenly fall during proposal 3796, from highest value of 116M to 113.5M, just after the proposal 3795 were failed.
In the image on the left, we can see the power share distribution change based on the validators rank. As we can see, it seems that the top 10 validators lost dominance during the second mid of 2022, but keep percentage at around 65% till November. During November the percentage increased to 67%, but during the past month, when proposals taken place, the dominance decreased again. These changes are good for the decentralization.
Before viewing the Nakamoto Results, first of all let’s explain what it Nakamoto Coefficient. Well, Nakamoto Coefficient is a measure of a blockchain networks decentralization representing the minimum number of validators whose proportions one can sum to get to X% control. In the case of Terra, 33% is the Bizantine Tolerance threshold.
Then, regarding the Terra’s Nakamoto coefficient, we can see how during the period previous to the proposal, it was at 4, then it is to say that 4 validators were needed to reach the bizantine tolerance fault to have more than a 33% of the voting power.
Since September 2022, the Nakamoto coefficient increased from 3 to 4 and remained stable until January 2023. Few days before proposals 3794, 3795 and 3796, Nakamoto Coefficient fall again to 3, but it seems that during these proposals it returned to 4 again. This uptrend must continue due to is good for the decentralization as more validators are needed for the fault tolerance.
Overview
Methodology
Key insights
Proposal 3795 (TerraPoker Grant) vs Proposal 3796 (ERIS Protocol Grant) Governance Results
Finally, regarding the voting results, we can see how for the proposal 3795, more than 60% of votes were ‘No’, 31% ‘Yes’, 5.5% ‘Abstain’ and less than 3% for ‘Veto’. Quite different from the proposal 3796 in which ‘Yes’ represented more than 64% of the total votes, ‘No’ less than 24%, Abstain 10% and ‘Veto’ less than 1.5%.
On the other hand, the percentage of new validators can clearly seen that increased on proposal 3796, being 25% for the first proposal and more than 30% for the second proposal. The numbers remained higher for Proposal 3796 if we consider the voting power, but in this case, the numbers are closer (27 vs 29%). Then, it seems that the EPIS Protocol Grant Proposal attracted more new users than the Terra Poker one.
Voting activity on proposals 3619, 3665, 3794, 3795 and 3796
In the first chart we can see the validators’ activity comparison on the recent proposals 3619, 3665, 3794, 3795 and 3796. On the one hand, the two first proposals were executed before Christmas while the other three, during the second week of January.
As a result, we can see how in this case there were more activity during the last 3 proposal rather than in the previous 2 others mainly because of the increase in activity during the last proposal 3796.
However, the highest daily activity was registered on December 13th with more than 90 votes and 90 active voters. In fact, taking into account the average votes per voter, we can see how in this case the highest number has been for proposal 3619 followed by proposal 3796.
In these charts we can see the voters’ activity during these five proposal. Take into account that the voters have been splitted by type depending on their age on the network. If a voter have joined the ecosystem 30 days before, it is catalogues as “new voter”, otherwise “old voter”.
As a result, we can see how in this case there were more old validators voting for the governance than new validators. However, it seems that more new users joined the governance over the past proposals. In fact, looking at the second image, it can be seen how the percentage of new voters decreased from proposal 3619 to proposal 3794, but increased from 3794 to 3796 proposals having the highest ratio in this last proposal.
Another interesting thing to consider is the increase in the activity of new voters during proposal 3795, where the amount of votes per new voter registered its highest value.
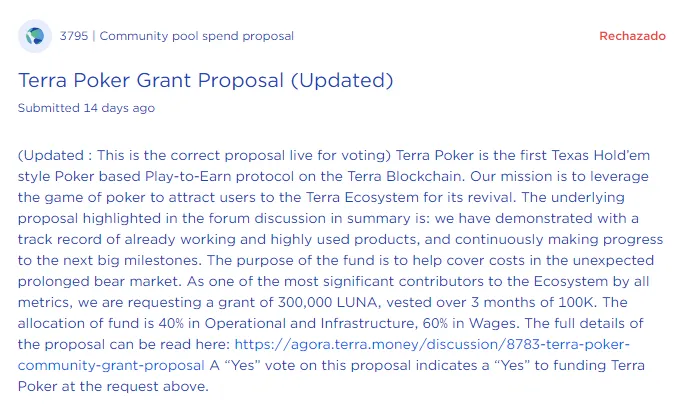
Proposal 3795: Terra Poker Grant Proposal
As it can be seen below, the first proposal to be compared is last failed proposal on Terra hosted by Terra Poker, the Texas Hold’em style Poker based Play-to-Earn protocol on the Terra Blockchain.
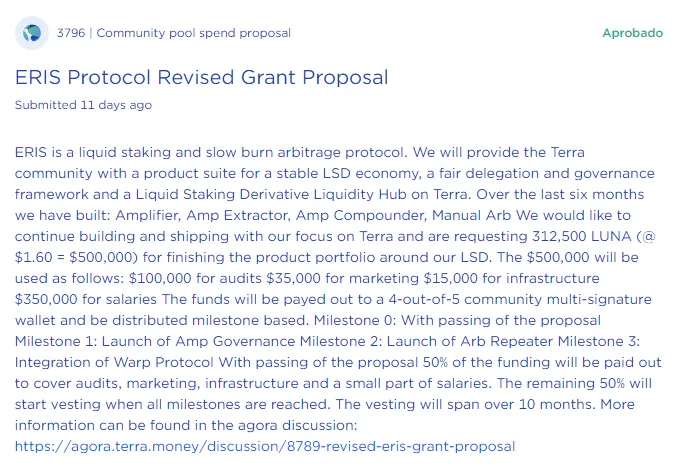
Proposal 3796: ERIS Protocol Grant Proposal
The second proposal to be compared is the last passed proposal on Terra hosted by ERIS Protocol, who provides Terra with a suite of products around liquid staking and creates a stable economy around yield-generating assets.
In this first charts, we can see a comparison of voting activity on the aforementioned two proposals. As it can be seen, while the first proposal had more activity during the first day than the second one, it seems that for the rest of the days, the second proposal had more activity than the first one. So, looking at the cumulative charts, we can see how more votes were casted on the proposal 3796 than in 3795.
Something similar gas occyrred with the number of voters on each proposal, in this case 324 different wallets voted for proposal 3796 while only 165 oted for proposal 3795.
Key insights
- There were more activity during the last 3 proposal rather than in the previous 2 others mainly because of the increase in activity during the last proposal 3796. However, the highest daily activity was registered on December 13th with more than 90 votes and 90 active voters. In fact, taking into account the average votes per voter, we can see how in this case the highest number has been for proposal 3619 followed by proposal 3796.
- There were more old validators voting for the governance than new validators. However, it seems that more new users joined the governance over the past proposals. In fact, looking at the second image, it can be seen how the percentage of new voters decreased from proposal 3619 to proposal 3794, but increased from 3794 to 3796 proposals having the highest ratio in this last proposal.
- After these proposals were voted, we can see how during the first two proposals (3619 and 3665) the voting power of top 66% of validators keep growing fast, from 112.3M to almost 113M. This trend continue with proposal 3794 and 3794 but suddenly fall during proposal 3796, from highest value of 116M to 113.5M, just after the proposal 3795 were failed.
- The top 10 validators lost dominance during the second mid of 2022, but keep percentage at around 65% till November. During November the percentage increased to 67%, but during the past month, when proposals taken place, the dominance decreased again. These changes are good for the decentralization.
- Since September 2022, the Nakamoto coefficient increased from 3 to 4 and remained stable until January 2023. Few days before proposals 3794, 3795 and 3796, Nakamoto Coefficient fall again to 3, but it seems that during these proposals it returned to 4 again. This uptrend must continue due to is good for the decentralization as more validators are needed for the fault tolerance.
First of all, let’s analyze the description of these two proposals and the intention of the projects for the launch of each proposal.
First, let's look at the Terra Poker Proposal 3795. Looking at the objective of the proposal, we can see that the team's intention is basically to raise funds to continue the project, without giving any concrete details of where the money will go and how it will contribute to the Terra ecosystem and its community. While it is true that Terra Poker has the potential to grow as it has a tremendous statistical track record, all we have seen so far is that they are using poker as the main product line, but without any impact on the communities on Terra other than growth. What angers voters the most is that Terra Poker previously raised money from a token sale launched at Valkyrie where the team was allocated 200,000,000 TPT tokens with a 3 month and 4 year term. which was a monthly revenue of $125,000. People believe that this is enough to get the project off the ground and do not see how a higher capital would benefit the project.
On the other hand, let’s take a look at the EPIS Protocol Proposal 3796. In the ERIS Proposal, we see that in this case, apart from raising funds to pull the project forward, there seems to be a clear community focus on sharing 50% of the rewards with the ampLuna holders, which gives a delegation and power of governance back to the community. The idea seems to provide an investment factor to TVL of 30 without dependence on other networks and associated risks. Given this and that Eris Protocol is a team that has demonstrated that it can deliver on reasonable costs such as infrastructure and return a percentage of what it receives to the community fund, it seems that voters are more in favour of this option. Also, in this case it seems that Eris Protocol has not raised funds prior to the Proposal, which makes the need for fundraising more useful and sincere.
After these arguments and clarifications on each proposal, lets take a comparison between voting activity and proposal results for these proposals. All the analysis can be found below with a final conclusions explaining several reasons why on of them passed and the other one failed.