USDC.grv/USDC pool analysis
Introduction
The Osmosis Labs team was a major contributor to the Osmosis Protocol (osmosis.zone). Osmosis is a first-of-its-kind automated market maker (AMM) that marks a foundational shift in how liquidity providers can benefit from Interchain DeFi. Osmosis allows users to compound yield by leveraging Osmosis’ novel innovation called Superfluid Staking; eliminates miner extractable value; and provides greater latitude for developers to innovate within DeFi given the flexibility of the Cosmos SDK.
As recently as January 2023, Pool 872 (USDC.grv/USDC) had ~$10,000 in TVL. But, today liquidity is less than $500. What happened to this pool? Where did these LPers go?
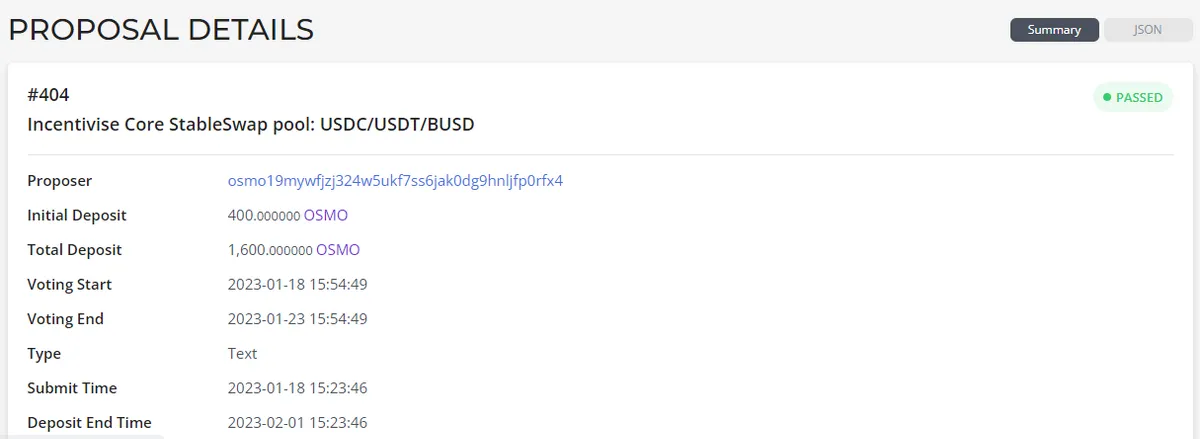
As well, in finals January 2023, a proposal about incentivizing pool 877 (3-pool formed by USDC/USDT/BUSD) passed [1]. Was the precipitous drop in LP activity driven by the release/incentivization of 3-Pools?
Methods
The idea behind this chart is to analyze the activity on the affected USDC.grv/USDC pool and track if LP users have been migrating their capitals to the 3-pool.
To do a good comprehensive analysis, I have analyzed not only the USDC.grv/USDC pool 872 behavior, but also the pool 877 behavior. In both cases, before and after incentivation proposal.
The main metrics analyzed are:
- Pool 872 deposits and withdrawals
- Pool 872 users depositing and withdrawing
- Netflow volume of pool 872
- TVL evolution of pool 872
- Netflow volume comparison between pool 872 and pool 877 before and after incentivation
- Pool 877 behavior (similar metrics as pool 872)
- Pool 872 users behavior in other pools
- Distribution of pools joined by pool 872 exitors
Pool #872 - USDC.grv / USDC
Looking at the USDC.grv/USDC pool #872, we can see how since mid December, the activity has been increasing in terms of actions and active poolers. But the volume has been decreasing.
While in case of actions, there have been more deposits than withdrawals, what users have been doing is mainly exiting the pool. In fact, it can be seen that the volume increased during the first evaluated days, but since mid January, the major of them has been negative, decreasing the TVL of the pool. As mentioned before, the TVL was at around 10k USD, but since January 15th it started to decrease reaching less than 500 USD at the finals of the month.
Key insight
- Since mid December, the activity has been increasing on pool #872 in terms of actions and active poolers. But the volume has been decreasing.
- While in case of actions, there have been more deposits than withdrawals, what users have been doing is mainly exiting the pool.
- As mentioned before, the TVL was at around 10k USD, but since January 15th it started to decrease reaching less than 500 USD at the finals of the month.
- Volume entered in pool #872 during December, but that from mid-January onwards, the volume basically dropped, especially a few days after the proposal.
- In pool #877, volume spiked in mid-January, a few days before the incentive, which is curious because right after the incentive, there was more volume going out than coming in.
- The top 3 pools where users are entering are: 907, 633 and 806 (extracting 872).
Activity before and after 3-pool incentivation proposal passed
In these two charts, we can see a comparison of how the net flow has evolved between the USDC.grv/USDC pool we are analysing and the pool that was voted for its 3-pool incentive. In this case, we can see how volume entered pool 872 during December, but that from mid-January onwards, the volume basically dropped, especially a few days after the proposal.
On the other hand, for pool 877, volume spiked in mid-January, a few days before the incentive, which is curious because right after the incentive, there was more volume going out than coming in. So where are the users of pool 872 really going? Even we are looking several people joining the pool and more deposits than withdrawals on the pool, there are more volume exiting than entering the pool.
Where are really pool 872 users going?
If we take a look at the exact movements of users who are exiting the USDC.grv/USDC pool, we can see that there are joining and exiting different pools. But the main activity resides in pool 872, where there are more users exiting than entering. Pool 907 is also interesting cause users are only entering this pool.
Looking at the chart of the right, we can see that the top 3 pools where users are entering are: 907, 633 and 806 (extracting 872).