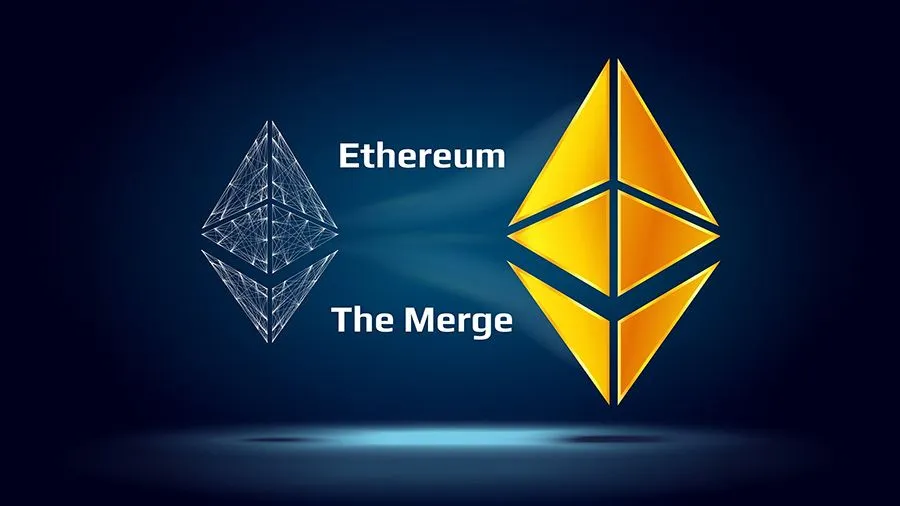
Post Merge Behavior
The merge has occurred. How have users responded in days that followed?
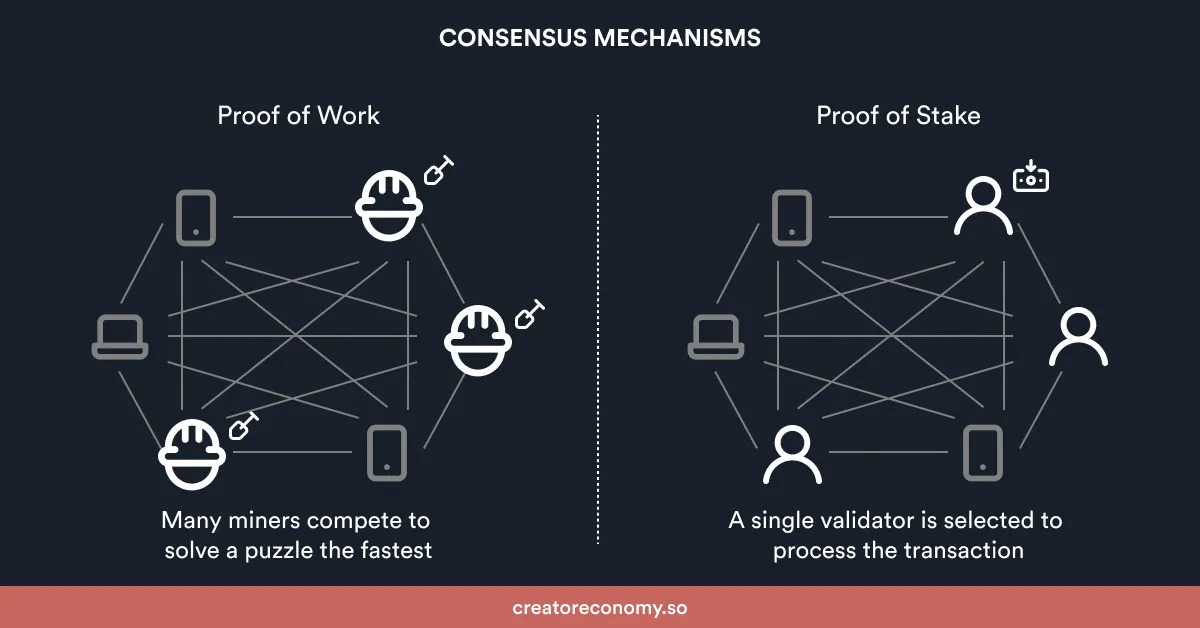
What is the Merge? \n the merge was the final step in ethereum's plan to completely switch from a proof of work (POW) to a proof of stake (POS) consensus mechanism.
when ethereum switches to proof of stake consensus mechanism the merge sets a new stage for the ethereum network to become more sustainable scalable and secure and it eliminated the need for energy-intensive mining additionally ethereum's state and transaction history will remain exactly the same after the merge meaning no action is required.
Proof of Work
-
The first miners to solve the puzzle is given a reward for their work.
-
In order to add the malicious block, you’d have to have a computer more powerful than 51% of the network.
-
To add each block to the chain, miners must compete to solve a difficult puzzle using their computers processing power.
Proof of Stake
- There is no reward for making a block , so the block creator takes a transaction fee.
- In order to add a malicious block , you'd have to own 51% of all the cryptocurrency on the network which is impossible.
- There is no competition as the block creator is chosen by an algorithm based on the user's stake
-
The right figure shows the amount of ETH staked by users before and after merge in the form of a bar graph.
-
As can be seen, since merge happened, the number of days when the volume was high is more.
-
The figure on the left is a comparison between the staked volume of ETH before and after merge in the form of a donut chart. 53% vs. 47%
Introduction
Last week (September 15), the event that many users were waiting for happened. In this dashboard, after the merge for Ethereum, we will review the following items in order:
- Changes in the amount of Ethereum staked by users.
- Changes in the volume of transactions made in terms of Ethereum.
- The trend of Ethereum price changes.
- Gas changes on the Ethereum network in terms of Gwei.
- Changes in the amount of time delay between two consecutive blocks in the Ethereum network in seconds.
- Changes in the number of Ethereum network miners.
- Ethereum network difficulty changes in terms of hash rate.
- We also compare this with user behavior in previous days and weeks.
Methodology
#change_of _stack_eth To calculate the stack volume, we preferred to use data related to the most famous platforms (direct staking, lido, ...). This includes more than 95% of the total data. Our effort has been to get the transaction volume based on ethereum. In some platforms, unrelated transactions were also called with this filter. So, to get related transactions, we used other filters such as ORIGIN_FUNCTION_SIGNATURE and the token address of the relevant platform. In the case of the Cream platform, the work became more complicated because the volume of transactions in terms of Ethereum was not specified for them in the ethereum.core.fact_transactions table. We only had the amount of the platform's own token that was transferred per Ethereum stack from the ethereum.core.fact_token_transfers table. Therefore, in order to obtain the volume of transactions in terms of Ethereum, we calculated the token price in terms of Ethereum using the ethereum.core.fact_hourly_token_prices table. By multiplying the amount of the platform's own token by its token price in terms of Ethereum, we obtained the amount of Ethereum stacked. To categorize the data based on before and after merge, we used a column called merge.
#transaction_vol First, we obtained the volume of daily transactions, and according to the time ofthe merge, we added a column named "merge" to categorize the days before and after the ethereum merge, and finally, we obtained the average volume of daily transactions separately for the time before and after the merge.
#eth_price To get the Ethereum price, we used the ethereum.core.fact_hourly_token_prices table (we only used the average hourly price to calculate the daily price).
#gas Here we used the ethereum.core.fact_transactions table and the GAS_PRICE column (note that gas is not based on dollars! It is based on Gwei!).
#speed To compare network speed before and after ethereum merge, we checked the delay time (based on seconds) between each transaction. It is necessary to explain that for a more detailed analysis, we obtained the average delays and maximum delays separately for before and after merge.
#miners We also got the number of daily miners.
-
The figure on the right shows the volume of transactions in terms of Ethereum after merge and before merge (the number of days is determined by the user using the parameter).
-
It shows the increase in the volume of transactions in recent days.
-
The figure on the left is a comparison between the volume of transactions in terms of ETH in the days before and after Ethereum Merge.58% vs 42%
-
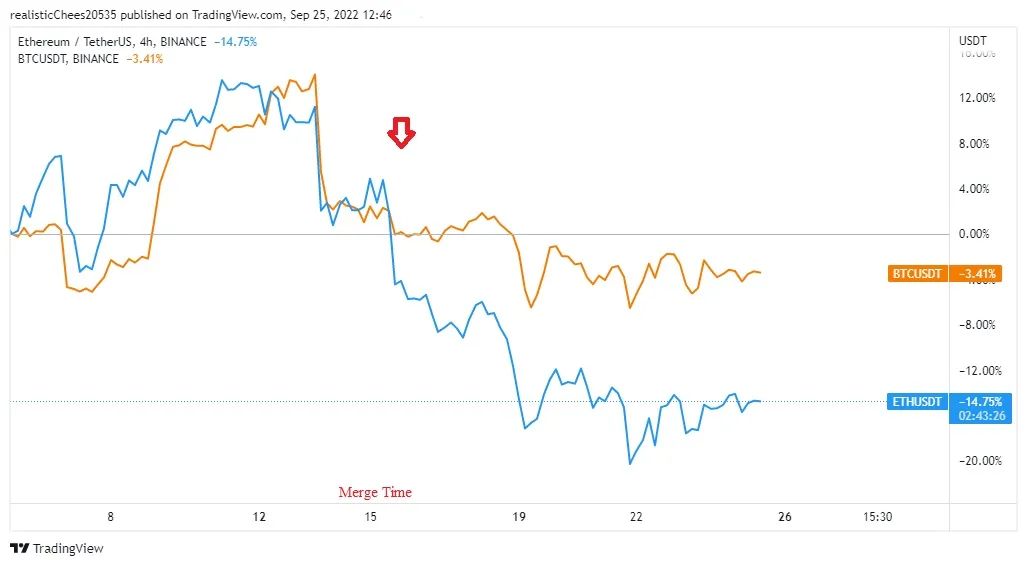
The figure on the right shows the trend of Ethereum price changes before and after ‘merge’.
-
As can be seen, its price drop has intensified after ‘merge’
-
By examining the figure on the right, it is not possible to conclude with certainty about the price trend because the price trend can also depend on the market conditions.
-
Therefore, in the figure on the left, we compare the price trend of Ethereum and Bitcoin, which is determined as the index of the entire market.
-
As can be seen, in the last week, the price drop of Ethereum was more than that of Bitcoin, which shows that its price drop was more severe than the price drop of the market index (Bitcoin).
-
The gas fee changes before and after the ‘merge’ are displayed with two bar and donut charts for review.
-
In the figure on the right, It can be seen that after the ‘merge’, the amount of gas fee of the network (6 Gwei) has decreased and has reached (20 Gwei) to (14 Gwei).
-
In the left figure, It can be seen that after the ‘merge’, it has decreased by 8.2%.
- The figure on the right shows the delay between two consecutive blocks in seconds, before and after ‘merge’.
- which shows a significant increase in speed after the ‘merge’ event.
- The figure on the left is a comparison of the delay time between consecutive blocks in the Ethereum network between before and after the ‘merge’ event.54% vs 46%
-
In the right figure, it shows the number of miners before and after the event of ‘merge’ in the form of a bar graph.
-
A significant increase in the number of miners is observed.
-
The left figure is a comparison between the number of miners before and after the event of ‘merge’. 90%vs 10% its awesome
Conclusion
- With the approach of ‘merge’ and even after that, the desire of users to stake ETH on the network has increased, which shows their increased interest and foresight For investment.
- One of the reasons for the increase in the volume of ETH transactions can be considered the reduction of network gas after the ‘merge’ incident.
- As we know, the price trend in the market depends on many factors, but as the news of the 'merge' for the Ethereum network became hot, the price trend of ETH currency took an upward trend in the bearish market conditions. And this means that this news caused the price of Ethereum to increase more than the market expected, but after the "merge" happened, this price increase was withdrawn and we are witnessing a decrease in the price of Ethereum more than the market trend.
- With the occurrence of ‘merge’ in the Ethereum network, it reduced the energy consumption for mining by miners due to the change of the method from proof of work to proof of stake, which as a result of this issue reduces network gas.
- With the occurrence of 'merge’, due to the change in the mining method from proof of work to proof of stake, instead of solving a difficult graphic puzzle, miners use an algorithm based on users' stake to mine, which reduces the time delay between two consecutive blocks and, as a result, increases the speed of the network.
- With the occurrence of ‘merge’ and the change of the method from proof of work to proof of stake, which was mentioned in the introduction of the dashboard, the conditions for mining have become easier and miners do not need powerful systems for mining, this will increase the number of miners.
- With the increase in the number of miners after the occurrence of ‘merge’ in the Ethereum network, it was expected that the difficulty of the network would increase, but with the change of the mine method from proof of work to proof of stake, miners no longer need to solve difficult graphic puzzles, and by algorithm based on the user’s stake They believe that this issue can greatly reduce the network's difficulty.
Parameters
-
According to the question request: (Compare this with user behavior in previous days and weeks.) We have defined two general parameters (change_cycle, days_before_merge) in such a way that all our comparison charts By adjusting these two parameters, it can accurately display the desired item of the audience.
#days_before_merge: If the target of our audience is to check twenty-eight days (four weeks, about one month) before the merge. Just set the days_before_merge parameter like this: (days_before_merge=28)
#change_cycle: This parameter makes it possible to check all charts daily or weekly according to the request of the audience. So, for example, for a daily check, it is enough to set the change_cycle parameter as follows: (change_cycle=day)
According to the user's preferences,
- The bar chart on the right, shows the daily (or weekly) difficulty since a few days ago (according to the user's value to the days_before_merge parameter) until now.
- This figure clearly shows the reduction of network difficulty.
- It should be noted that the figure on the right also includes a line diagram, that shows the highest difficulty of the network.