Validator Voting vs. Investor Inclinations

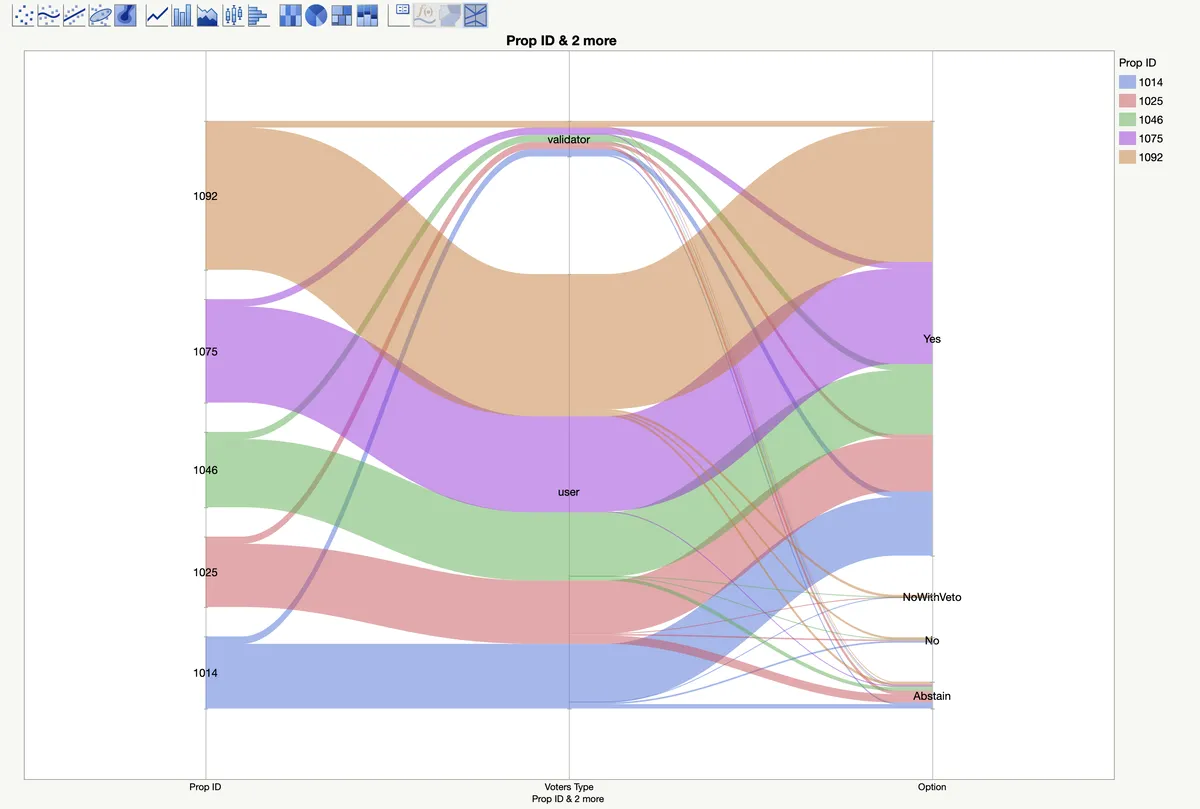
    In this dashboard, we will analyze the last 5 governance proposals and see the distribution of voters between retail investors vs validators for the votes in favor.

    Loading...

    First, let's take a look at the 5 of the most recent governance proposal. The following proposals has passed the quorum and pass threshold.

    Loading...

    Graph below shows the address voting count for those 5 proposal. Prop ID 1092 has the highest voters despite the voting still live right now. All of these past 5 proposals has majority voting in favor of the proposals.

    Now let's take a look at users type of voters for those 5 proposals. On average, around 70 out of 130 active validators (~55%) has voted at all.

    Loading...
    db_img

    The summary of the past 5 proposals voting are visualized in Sankey Diagram below. We can see that most of the votes are in favor for these 5 proposals.

    And out of those votes, let's see the voters count who voted in favor of the proposal and see the voting power coming from validators and retail users addresses.

    Loading...

    From the voting power graph, we can see that the voting power is very minuscule compared to voting power from validators. On average, validators carries over 99.8% of vote weight.

    Loading...
    Loading...

    In conclusion, total voting power coming from delegators are quite large compared to retail users eventhough voting turnout from retails users are higher.