Network Performance Dashboard
Introduction:
I created a dashboard that displays Solana network performance over time.I checked that: How was the performance of the network in the last month compared to the rest of the year? Has the transaction per second and transaction success rate increased recently? Is this due to less usage or fewer users or new improvements by Solana engineers? Which wallets and apps have paid the highest fees for failed transactions?


According to the tables, you can see that June had 0.892 billion transactions.
But the highest transaction in 2022 is in January with 1.229 billion transactions.
After January, we had 1.174 billion transactions in February. The lowest number of transactions was in April with 449 million transactions
The following code tables came up in violation
select date_trunc('month',block_timestamp::date), count(1) from solana.core.fact_transactions where block_timestamp::date between '2022-06-01' and '2022-06-30' and succeeded = TRUE group by 1 order by 1 desc
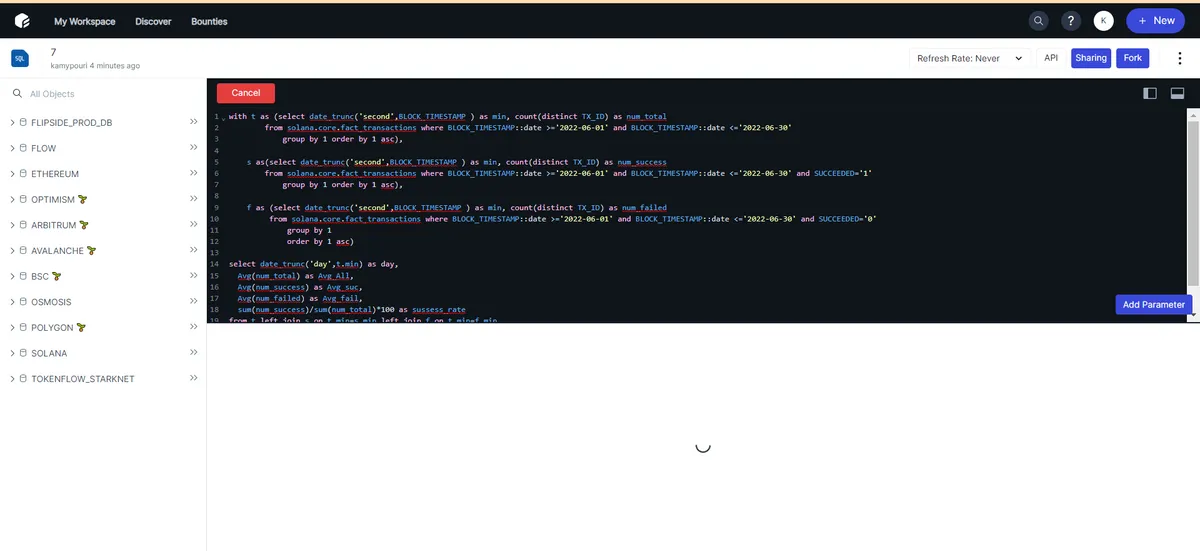
Has transaction per second and success rates of transactions gone up recently?
Due to the problem of the site, I could not run this code at the appointed time
with t as (select date_trunc('second',BLOCK_TIMESTAMP ) as min, count(distinct TX_ID) as num_total from solana.core.fact_transactions where BLOCK_TIMESTAMP::date >='2022-06-01' and BLOCK_TIMESTAMP::date <='2022-06-30' group by 1 order by 1 asc),
s as(select date_trunc('second',BLOCK_TIMESTAMP ) as min, count(distinct TX_ID) as num_success
	from solana.core.fact_transactions where BLOCK_TIMESTAMP::date >='2022-06-01' and BLOCK_TIMESTAMP::date <='2022-06-30' and SUCCEEDED='1'
		group by 1 order by 1 asc),

f as (select date_trunc('second',BLOCK_TIMESTAMP ) as min, count(distinct TX_ID) as num_failed
	 from solana.core.fact_transactions where BLOCK_TIMESTAMP::date >='2022-06-01' and BLOCK_TIMESTAMP::date <='2022-06-30' and SUCCEEDED='0'
		 group by 1
	 	 order by 1 asc)
select date_trunc('day',t.min) as day, Avg(num_total) as Avg_All, Avg(num_success) as Avg_suc, Avg(num_failed) as Avg_fail, sum(num_success)/sum(num_total)*100 as sussess_rate from t left join s on t.min=s.min left join f on t.min=f.min group by 1 order by 1 asc