SUSHI During Volatile Times
This dashboard aims to provide insight into the swap activity of SUSHI across Ethereum, Polygon and Harmony.
Introduction
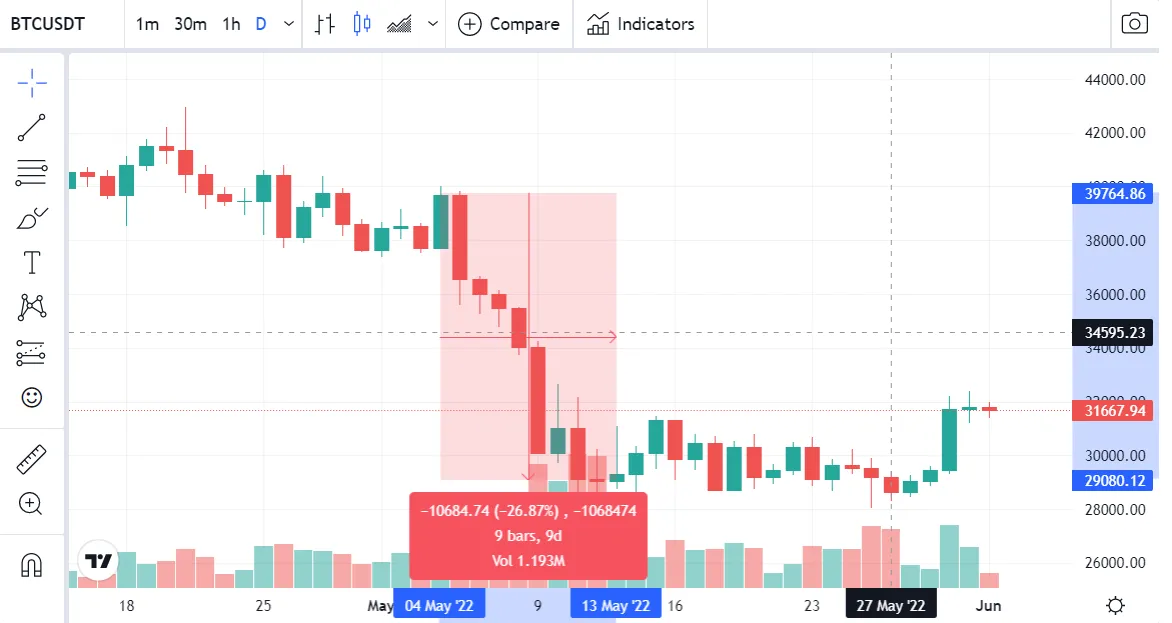
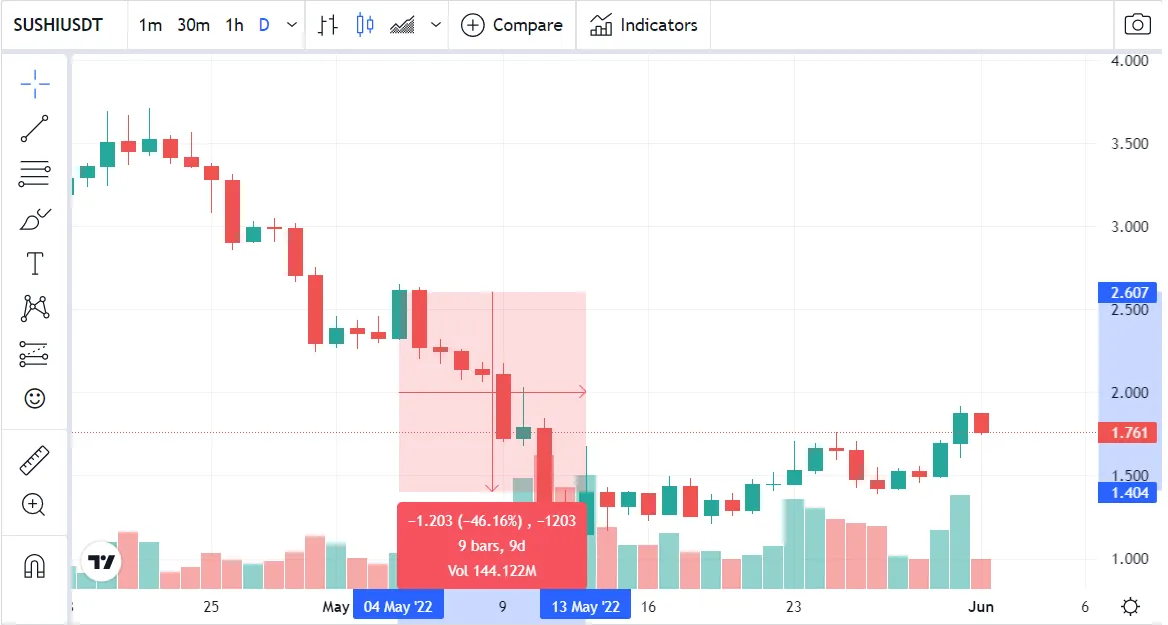
This dashboard aims to compare SUSHI swap activity across Ethereum, Polygon and Harmony during the recent volatility spike. We define swap activity as the total number of swaps and swap volume. We define the period of recent volatility as the period between May 4th and May 13th. As can be seen in the graphs below, Bitcoin dropped over 26% and SUSHI dropped over 46% in this period.
Methodology
- Daily number of SUSHI swaps and volume for ETH and Harmony: This data for Ethereum and Harmony was collected using the
crosschain.ez_swapstable. We then filter for the respective chains, the period between May 4th and May 13th and for swaps using the SUSHI token. Then we usecount(distinct(tx_hash))to identify the number of swaps andsum(amount_in_usd)to identify the swap volume. - Daily number of SUSHI swaps and volume for Polygon: For Polygon a different table had to be used, namely
polygon.udm_events. In this table, we filter for SUSHI swaps usingcontains(to_address_name, 'SUSHI')and for the volatility period. Then we again usecount(distinct(tx_id))andsum(amount_usd)to identify the number swaps and the total volume. - Finally we group this data per day and for the whole volatility period.
First, we look at the daily number of SUSHI swaps on the chains during the volitity period between May 4th and May 13th. We can see that Polygon and Harmony had a similar number of daily swaps, while Ethereum clearly had fewer swaps. This is also reflected in the total number of swaps during this period:
There we about 2.3 times as many swaps on Polygon during the period compared to Ethereum.
Finally, we'll look at the total volumes over the whole period:
Conclusion
- Polygon had the higher number of swaps during the volatility period at about 10k swaps. Ethereum had the least number of swaps at about 4.6k.
- While Ethereum had the least number of swaps, the total volume was by far the largest on Ethereum during the volatility period.
- The SUSHI swap volume on Ethereum was about 850x larger compared to Polygon and about 85x larger compared to Harmony.
While Ethereum had the least number of swaps, the total volume was by far the largest on Ethereum. Using a logarithmic scale shows this better:
We can see that swap volume on Ethereum was about 850x larger compared to Polygon and about 85x larger compared to Harmony.