Swap and Dex Info
We can find swappers and swap metrics using the above charts.
According to the graph above, the number of weekly swappers peaked on January 17 and has since fallen till early May when it started to increase to form a new peak.
Also, the number of weekly swaps transactions and volume for both token in and out, peaked on January 24.
Average Swap and Market share Info
The above visualizations display the market share in terms of transactions and exchanged volume and the growth of these parameters.
As can be seen, the FUSD/USDT pair has received the greatest share of the total swap transactions and volume (for both token in and out).
Additionally, FLOW/USDT pair has the greatest share of swappers with more than 15% of total swappers.


Conclusion
- The number of weekly swappers peaked on January 17 and fell until early May, when it resumed rising. Also, the volume and number of the weekly swap peaked on January 24.
- FUSD/USDT has the most swap volume and transactions (both token in and out). FLOW/USDT has the most swappers, with over 15%.
- Every week, a lot of FLOW is staked, whereas unstaked tokens are negligible. The average charts match the staking data.
- In the second half of January 2022, Solana and BSC to Flow bridge transactions and users spiked. Flow received BLT and STARLY from Solana and BSC, while Ethereum sent RLY and USDC.
- Most Bridgers prefer blocto over cbridge to bridge their assets to Flow. In July 2022, bridging from Flow to BSC resulted in $2.93M per week in bridged traffic.
- Outbound bridged activities moved assets from Flow to Ethereum. Solana and BSC got BLT and STARLY, while Ethereum got USDT and FLOW. Most bridgers favor blocto over cbridge to bridge assets from flows.
Inbound Bridge Activities Info
The illustrations in the above display the weekly bridging transactions coming into the flow network from other chains.
there was a spike in the number of transactions and unique bridge users bridging from Solana and BSC to Flow in the second half of January 2022, Although on this date, Ethereum had the highest bridged volume,
Flow primarily received BLT and STARLY tokens from Solana and BSC, while Ethereum mostly sent RLY and USDC.
According to the charts, most Bridgers prefer to use blocto to bridge their assets to Flow, while a small minority prefer cbridge.
Outbound Bridge Activities Info
The visuals in this section display the bridging overview for transactions exiting the Flow network and entering other chains.
When bridging from Flow to BSC in the third week of July 2022, there was a rise in the volume of transactions, which resulted in $2.93M in bridged traffic per week.
Outbound bridged activities were mostly used to move assets from the Flow network to the Ethereum chain.
As in the previous section, Solana and BSC primarily received BLT and STARLY tokens, whereas Ethereum received USDT and FLOW.
Similar to the preceding section, most bridgers prefer to use blocto to bridge their assets from flows, with only a small minority choosing to use cbridge.
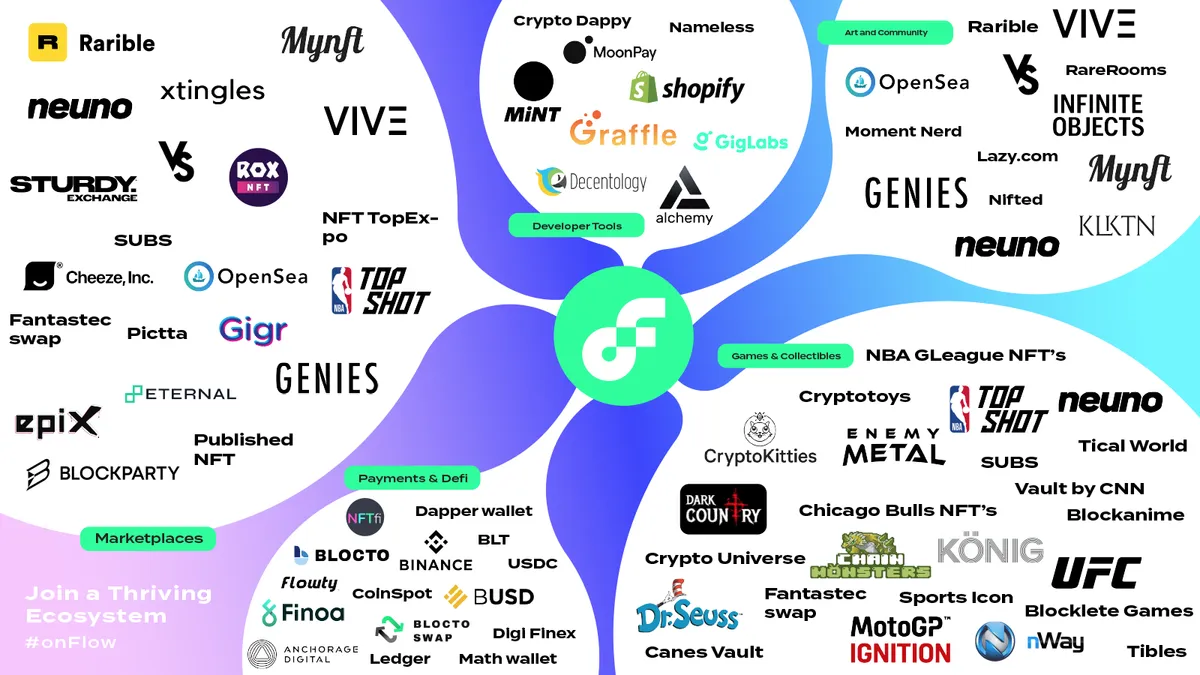
Defi on Flow
-
Flow, takes a novel distribution approach and balanced token design that combines the best aspects of DeFi with developer-friendly tools, highly scalable four-node architecture, and a commitment to uncompromising decentralization. This lets developers focus on experience, and users enjoy speed and reasonable transaction costs, as well as an actively thriving ecosystem.
\
-
The Flow token enables participation on the platform, through which users can earn rewards. The crypto token demand is driven by platform activity like other DeFi tokens and allows for secondary tokens to be minted, such as stablecoins, governance tokens, and NFTs. A community token offering by FLOW will allow for widespread distribution and decentralization.
from :
Methodology
-
I will write this dashboard to build an analysis that tracks prices for Flow fungible tokens, looking for the following data points: ticker, volume on DEX by ticker, volume on CEX by ticker, liquidity on DEX, price, market capitalization and fully diluted value.
-
I will access Flow Blockchain information by queering into Flipsidecrypto tables.
\
-
Also, I will use the weekly information to find a general idea about Flow Defi Ecosystem. Also, you can use this dashboard to find specific details for your desired Flow fungible token.