Avalanche Block and Transaction Performance
Flipside has Avalanche data! It's now time to start digging into the blockchain's performance at a high level. Avalanche supports quick block finality and high TPS, can we see this in block and transaction performance since 6/20?
Introduction
According to the claim made here, Avalanche is a Proof of Stake network that can support up to 4500 transactions per second (4500 TPS). One of the aims of this dashboard is to put this claim to the test, as well as look into other block and transaction performance metrics since 6/20.
Methodology
- Firstly, the average TPS data grouped by the hour was gotten by using the
avalanche.core.fact_transactionstable to query for the total transactions made per hour, then divide that value by 3600 seconds to get the average transactions per second. The query result was then grouped by the hour and a chart depicting this result will be shown on this dashboard. - Next, the transactions per block data was calculated by querying the
avalanche.core.fact_blockstable usingMAX(tx_count),MIN(tx_count)andAVG(tx_count)functions to get the maximum, minimum and average transactions count respectively.These transactions per block data will then be shown on this dashboard. - Thirdly, the average time between blocks was gotten by querying the
avalanche.core.fact_blockstable using theLAGfunction to get the previous block's timestamp associated with each block and then using theDATEDIFFfunction to get the time difference between successive blocks. This data is then grouped by the hour and a chart illustrating this will be shown on this dashboard. - Finally, the average gas price per hour data was gotten by querying the
avalanche.core.fact_transactionstable usingDATE_TRUNC('HOUR', block_timestamp)andAVG(gas_price). A chart illustrating this queried data will be displayed.
-
The above table shows the average transactions per second grouped by hour, the bar chart below it illustrates the table data.
-
We can observe from the chart that most of the average TPS (Transactions Per Second) values are below 4 TPS and above 1 TPS.
-
Two outlier average TPS values can be observed. One above 4 TPS and the one far below 1 TPS. The one above 4 TPS occurred within the 2 AM hourly bar on June 24, 2022, and the one below 1 TPS occurred within the 3 PM hourly bar on the same day.
-
The first bar of the chart has an average hourly TPS value of 2.629444 TPS and the last bar has an average hourly TPS value of 2.508333 TPS.
We can observe the following information from the above table and single number charts:
- The maximum transaction count per block is 144 transactions per block
- The minimum transaction count per block is 0 transaction per block
- The average transaction count per block is 5.57 transactions per block
From the table and line chart above, we can state the following:
- Most of the average time values between blocks are about 2 seconds
- An outlier average block time value of 10 seconds can be observed between 2 PM to 4 PM on June 24, 2022, which is very similar to what was observed on the bar chart under the Average Hourly Transactions Per Second section.
From the table and line chart above the following can be observed:
- The majority of the average gas price values are below 60 nAVAX.
- Four average gas price spikes above 60 nAVAX can be observed on the chart i.e. 64.37165 nAVAX which occurred at 4 PM June 20 2022, 105.2926 nAVAX at 2 AM June 24 2022, 67.83328 nAVAX at 11 AM June 24 2022, and 156.0089 nAVAX at 3 AM, June 25 2022.
Conclusions
- The highest transactions per second observed under the Average Hourly Transactions Per Second section excluding the outlier is 3.7125 TPS, which is far below the 4500 TPS the Avalanche network is claimed to be capable of processing.
- The time between blocks is usually consistently around 2 seconds.
- One of the times gas prices skyrockets on the Avalanche network is when bots are actively performing transactions. Surprising the average Transactions Per Second and the time between blocks don't seem to be affected negatively by these bot transactions.
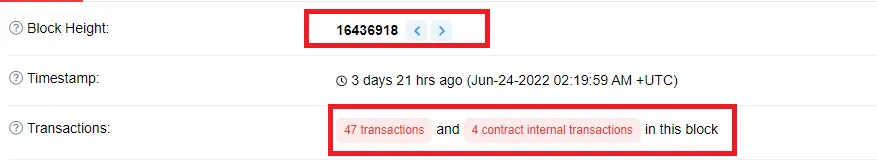
During the investigation of the cause of the outlier values that occurred at 2 AM, JUN 24, 2022 seen on most charts above, it was discovered that there are discrepancies between the values queried from the tables and the values shown on the Avalanche block explorer. For example, the transaction counts per block shown for block 16436918 on the tables are much higher than the actual transaction counts on the block explorer. The table and screenshot above clearly show this discrepancy. This data error is therefore the reason for the outlier values across most charts during that time range.
Similarly, the outlier values observed around 3 PM on the same day across most charts above are due to block data missing from the Avalanche tables. So, we should exclude data or information within these two time ranges.
While attempting to find the cause of the 156.0089 gas price value that occurred at 3 AM, June 25 2022 as observed on the line chart under the Average Hourly Transaction Gas Price section, multiple transaction hashes with gas prices of 1000 nVAX and above, with the highest gas price being above 40,000 nVAX associated with transaction hash 0x4f3b1cf377fdcac9a451e93e9e97ffc388d52fe870784e65f438a9f7b4024c07 were observed. The table and the bar chart above illustrate this. Let's proceed to see what all these transaction hashes have in common.
As we can observe from the above table and chart, the one thing they have in common is multiple transactions. Transaction hashes that are associated with humans tend to usually have just 1 transaction, transaction hashes associated with bots on the other hand tend to have multiple transactions. So, bots probably trying to take advantage of arbitrage opportunities are very likely the cause of the high gas price.