Daily Transactions and Unique Addresses
In this dashboard we aim to explain about daily transactions and unique addresses on polygon beginning June 1, 2021.
From the above charts I am not able to tell whether transactions are going up or down by considering this and to get a more clear view on this let's consider weekly basis. From the below graph we can see
- Weekly active wallets
- Weekly Transactions Since June 21.
For the Ethereum blockchain, Polygon is a secondary scaling solution. Rather than using their own blockchain, these solutions integrate with an existing blockchain network. Polygon works on Ethereum, which has become increasingly slow and costly as it becomes more popular.
Platform Polygon uses Ethereum’s blockchain to connect Ethereum-based projects. In addition to increasing the flexibility, scalability, and sovereignty of a blockchain project, the Polygon platform offers the security, interoperability, and structural advantages of the Ethereum blockchain.
In this dashboard let us examine the following metrics
- Active wallets
- Transactions
\n
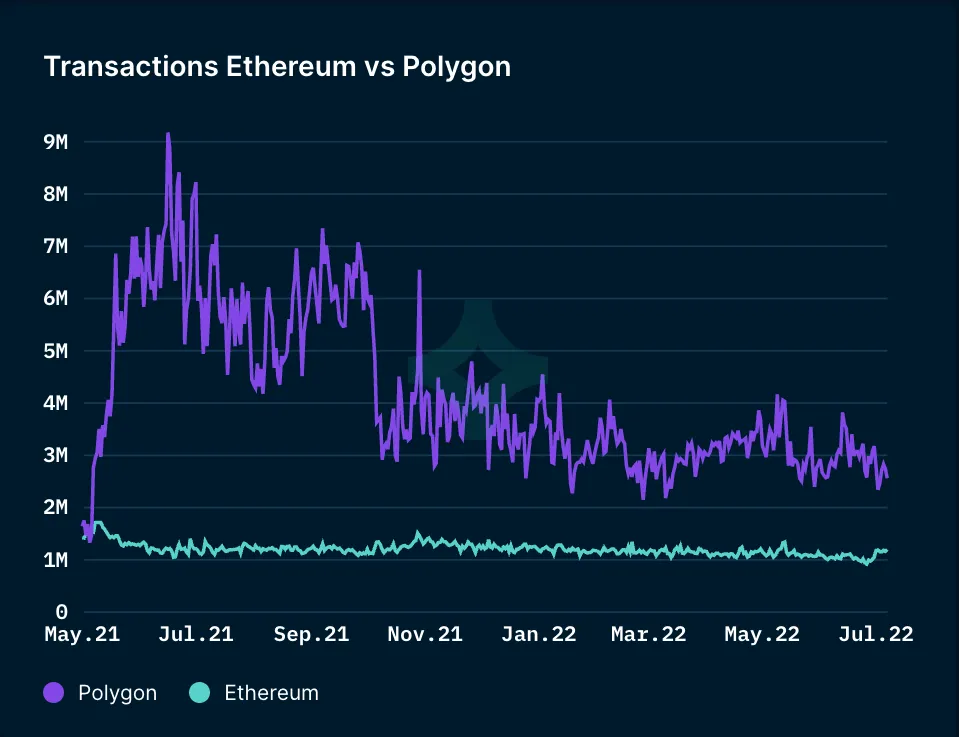
Since the data on flipside crypto warehouse is not sufficient enough to draw conclusions. I looked around and found Polygon metrics on nansen website -
The chart on the left shows the bigger picture of transactions on Polygon and also compares it with Ethereum. As you see on the chart, Polygon’s growth peaked in May 2021 and since then its on the somewhat down trend.
Starting Nov 2021 the growth of transactions on Polygon are flat and it is interesting to note that the transaction volume on Polygon is holding steady when compared to Jan 2022 even in the current bear market conditions.