Avalanche Performance
Flipside has Avalanche data! It's now time to start digging into the blockchain's performance at a high level. Avalanche supports quick block finality and high TPS, can we see this in block and transaction performance since 6/20?

Avalanche is an open-source platform for launching decentralized applications and enterprise blockchain deployments in one interoperable, highly scalable ecosystem. Avalanche is the first decentralized smart contracts platform built for the scale of global finance, with near-instant transaction finality. Ethereum developers can quickly build on Avalanche as Solidity works out-of-the-box.
A key difference between Avalanche and other decentralized networks is the consensus protocol. Over time, people have come to a false understanding that blockchains have to be slow and not scalable. The Avalanche protocol employs a novel approach to consensus to achieve its strong safety guarantees, quick finality, and high-throughput without compromising decentralization.
In this dashboard, we are going to measure some performance related stats about Avalanche blockchain and see how they've changed since Jun 20.
To answer this bounty's questions, we are going to use avalanche.core.fact_blocks and avalanche.core.fact_transactions tables.
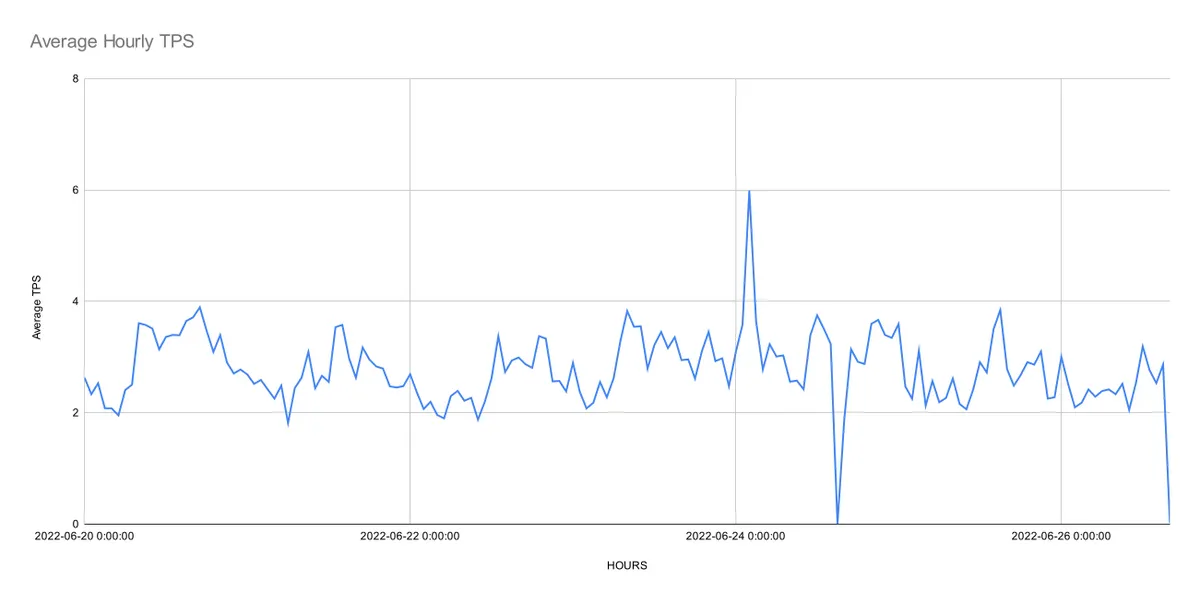
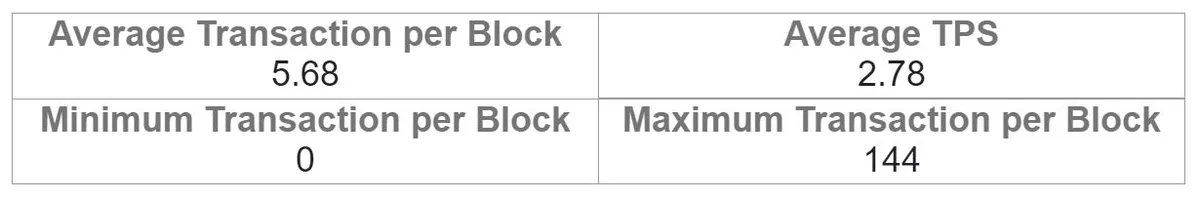
First, we'll use date_trunc(hour) on the blocks table to break block timestamps into hours, and measure avg, max, and min of transaction_count. and also we can find the average TPS per hour with this data.
Here are two charts of Maximum, Average, and Minimum transactions per block and hourly TPS over time for Avalanche blockchain since Jun 20. We can see that on June 24th, TPS drops down to zero, and the three tx per block lines meet up which is not a normal situation. We can investigate more on that.
We'll use a more constrained query to zoom into the Avalanche blocks data. here is a chart presenting blocks per minute between 14:30 - 17:00 of Jun 24.
Since no clear reason was found for this lack of data on the internet, we could assume that this is a gap in the Flipside data.
Let's sum up the transaction data we have analyzed so far.
In order to measure the time between each Avalanche block, we can use the LAG() function on the blocks table. The key part of this query is these 2 lines of code:
LAG(block_timestamp) OVER(ORDER BY block_number) AS last_block_timestamp,
TIMESTAMPDIFF(SECOND, last_block_timestamp, block_timestamp) AS time_difference
From the results of this query, we can extract the average time between the blocks and the average change over time.
We can see that the Avalanche blockchain has kept a steady average of 2 seconds between each block. There is a sudden spike in the chart, which is the result of the lack of data discussed before.
We move on to the Transactions table to look at the gas prices and transaction fees. We use date_trunc(HOUR, block_timestamp) AS hours to break down the transactions and find the average, max, and min gas prices, and average transaction fees.
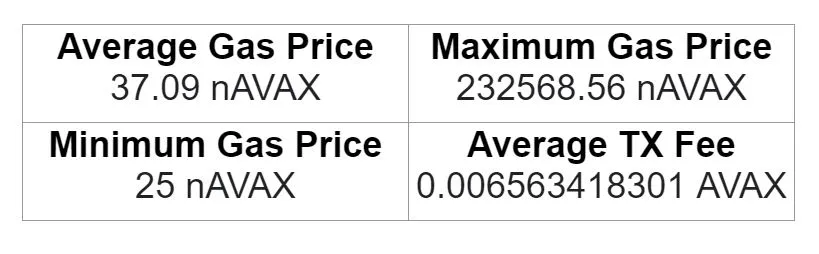
Note: The result for average transaction fee here is rounded and the actual average is 0.006563418301.
In the first glance, we can see the effects of the data gap discussed above. The interesting thing about these two chart is that although the maximum gas price is recorded as 232k, the maximum transaction fee has not gone up more than 0.014 AVAX.
- There was a one hour gap in the blocks table on Jun 24, 15:00.
- On average, Avalanche blocks contained 5.56 transaction per block.
- The recorder TPS was around 2.78 which is a long way to the advocated TPS by the network developers (4500 TPS) - Avalanche.
- Average transaction fee for Avalanche transactions is 0.0065 AVAX