Algorand Price Correlation
Is the price of Algorand more closely correlated with the crypto market, and assets such as BTC or ETH, or is it more correlated with network usage such as number of transactions or ALGO transfers?
WHAT IS ALGORAND?
Algorand (ALGO) is both a digital currency and blockchain platform. The Algorand platform is designed to process many transactions quickly, similar to a major payments processor like Mastercard or Visa. Algorand can host other cryptocurrencies and blockchain-based projects, making it a direct competitor to Ethereum. ALGO, the platform's native currency, is used to secure the Algorand blockchain and pay processing fees for Algorand-based transactions.[1]

WHAT ARE WE LOOKING FOR IN THIS STUDY?
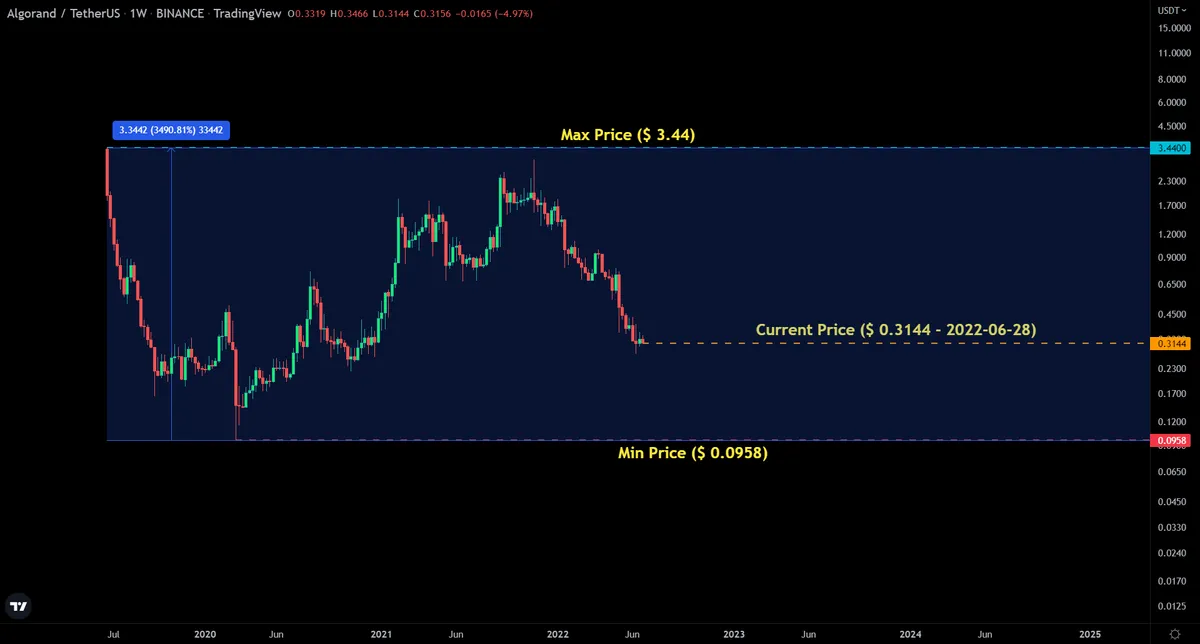
As we said, ALGO is the main coin of the ALGORAND network. By referring to Binance Exchange, we find that ALGO has been able to experience the minimum price of 0.0958 and the maximum price of 3.44 in USDT, and at the time of writing this report, it is trading at around $ 0.314. Price fluctuations in cryptocurrencies are very high and ALGO is no exception to this rule. We see that the price fluctuation between the minimum and maximum price of this coin has been 3491%.
The question is, does the price of ALGO depend on crypto market conditions such as the price of BTC and ETH, or does its price depend more on network usage such as the number of transactions or ALGO transfers or other factors? In this research, we are going to answer these questions visually and see what the correlation of ALGO price with the factors mentioned in this research is.
Results
A. COMPARISON OF THE PRICE OF ALGO WITH OTHER COINS AND TOKENS THAT ARE EFFECTIVE IN MARKET PRICE CONDITIONS
We know that Bitcoin and Ethereum are among the leaders in the cryptocurrency market, so we should rightly compare the price of the ALGO with these two leaders. In the meantime, we must also pay attention to the networks and their coins or tokens that affect the recent market situation. Definitely two of the most important of these tokens are the LUNA coin for the Terra network and the CEL token for the Celsius network. In mid-May, Stable Coin UST lost its peg to the USD on the Terra network, causing severe sales pressure in the cryptocurrency market. The Celsius network was also in crisis due to what happened to the Terra and Anchor networks, and the CEL token price situation created critical conditions for Celsius network users and the market. So we decided to compare the price of ALGO with these two other tokens and calculate their correlation.
A. Comparison of ALGO Price With Other Criteria
In this section, the price of ALGO has been compared with other aforementioned metrics over a daily basis on the past year, and their charts have been visualized. In this section, the maximum number of available data for each metric is considered (366 days). While the total number of records available for ALGO price on a daily basis (since the preparation of this report) has been 264 days, it is clear from its reflection in the below figures.
B. Computing of the Correlation Coefficient of ALGO Price with the Other Criterions
After visually comparing the price of ALGO with other metrics, it was necessary to calculate the Correlation Coefficient (CC) of ALGO price with the desired criterion. Given that the number of lost data in ALGO price records in daily periods is more than 20% of a year (366 days), we could use special methods to fill in the missing data with computational data (for example, the arithmetic average of existing recorders) However, this measure reduced the accuracy of the CC, so in this section, unlike Section A, the minimum number of available data (264 or less) is considered so that the calculations related to the CC have higher accuracy.
Correlation Coefficient (CC)
According to the definition of the Pearson Correlation Coefficient, the following properties can be proved for it.
- Non-unit: Pearson correlation coefficient does not depend on the unit of measurement of the data. That is, it is an index without a unit. Sometimes it is even expressed as a percentage.
- Pearson Correlation Coefficient symmetry: It is clear that the Pearson Correlation Coefficient has symmetry. Because
COV(X,Y)=COV(Y,X) - Measuring the linear relationship between two variables: The closer the value of the Correlation Coefficient is to 1 or -1, the greater the linear relationship between the two variables.
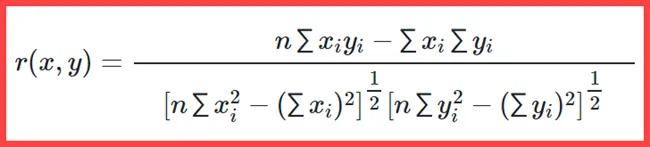
The main relationship of the Pearson correlation coefficient is the following equation:[2]
The results of calculating the ALGO price Correlation Coefficient with the desired assets prices are published in Table 1.
As you can see, the highest price correlation of ALGO is 0.9 (excellent) with BTC. This correlation with the price of ETH also has a significant value of 0.89. There is no correlation between ALGO and LUNA prices (-.027). The correlation between ALGO and CEL price is also noteworthy and is equal to 0.79.
A-1. ALGO and BTC Prices
Figure 1 shows the comparison of ALGO to BTC token prices on a daily basis over the past year. This chart shows that with the fall of BTC, the price of ALGO has also decreased.
Note: As mentioned earlier and shown in the chart, the price of the ALGO is available on Flipside tables from October 7th, 2021 onwards.
A-4. ALGO and LUNA Prices
Comparing the price of ALGO with LUNA (Figure 4), from December 25, 2021 to January 31, 2022, We see that with the relative decrease of LUNA price, the price of ALGO has also decreased. After this date, LUNA has seen an increase in price, but the price of ALGO has continued to fall.
After Terra Cash on May 5, 2022, and a sharp drop in LUNA price, the ALGO token has not changed much in price and seems to have been well supported in the market.
B-1. ALGO Price and Number of Transactions
Figure 5 shows a comparison of the price of an ALGO token with the number of transactions in Algorand that have taken place over the past year on a daily basis. We see that in some cases, despite the increase in the number of transactions, the price of ALGO is still declining.
B-2. ALGO Price and ALGO Transfer Volume
One of the most frequent and important events of any network is the transfer of tokens between different wallets and protocols inside the network or even outside the network. In Figure 6, we compared the volume of ALGO transfers over the past year on a daily basis with the ALGO price.
This chart shows that despite the constant rate of ALGO transfer volume in-network, the ALGO price has continued to decrease. Even on some days, despite the sudden increase in ALGO transfer volume, we still see the ALGO price has fallen.
B-4. ALGO Price and ALGO Volume Move (TO/FROM) CEX
Among the news and traders, we always hear that the transaction of coins or tokens between exchanges (centralized or decentralized) and wallets is a sign of market transformations and changes in cryptocurrencies price. We decided to investigate the relationship between the price of ALGO and the volume of entry and exit of this coin to centralized and decentralized exchanges separately. Figure 8 shows the comparison of ALGO price with ALGO volume move to/from CEX. The chart shows that the volume of ALGO inflows and outflows to exchange offices has fluctuated a lot, but the downward trend of ALGO prices has remained constant.
B-5. ALGO Price and ALGO Volume Move (TO/FROM) DEX
Figure 9 shows the comparison of ALGO price with ALGO volume move to/from DEX. The chart shows that from April onwards, the volume of ALGO transfers to/from DEXs has increased to some extent, and on the contrary, the price of ALGO is still decreasing.
B-6. ALGO Price and Swapped (TO/FROM) ALGO Volume
The last case that we decided to investigate in this research is the relationship between the price of ALGO and the volume of swapped by ALGO TO other tokens and also FROM other tokens to ALGO. Its chart is shown in Figure 10. As same as the previous chart, it is clear that from April onwards, despite a relative increase in swaps TO and FROM ALGO, the price of this coin is still declining.
B-7. Correlation Coefficient ALGO Price with Mentioned Metrics
After comparing the ALGO price chart with the other criteria mentioned above, it was necessary to calculate the CC of each of them with the ALGO price to see where we are.
The values of the correlation coefficients between the price of ALGO and other metrics mentioned in section B (Table 2) are not at all comparable with the values mentioned in the criteria stated in section A and are at a very low level.
Table 2 shows the 9 correlation coefficients for the 9 criteria mentioned, and despite their small values, which indicate that there is not much relationship between the price of ALGO and these metrics, interesting points can be deduced from them.
As mentioned in sections B-6 and B-5, from April onwards, there is an inverse relationship between the price of ALGO and the volume of ALGO Move TO/FROM DEXs, as well as the swapped volume of this coin (TO/FROM). We can see in Table 2 (rows 3, 5, 7 and 8) the CC values are also negative, indicating an inverse relationship between these metrics and ALGO price data.
CONCLUSION
In this study, we sought the relationship (correlation) between the price of ALGO coin with some of the most important in-network (Algoran blockchain) and out-network metrics.
We compared the chart of each criteria in one year period and on a daily basis with ALGO price chart and also calculated their correlation coefficient in separate tables.
Finally, according to the results in Tables 1 and 2, we concluded that external factors of the Algorand blockchain including market situation (comparing the price of ALGO with market leader coins such as BTC and ETH) have the greatest impact on the price of ALGO Coin. And explicitly in Table 1, we saw that the correlation coefficient of BTC, ETH and CEL coins are 0.9, 0.89 and 0.79, respectively, which shows a very high correlation between the price data of these tokens and the price data of ALGO. **But keep in mind that the existence of a high correlation coefficient between two non-discrete criteria such as the price of ALGO and BTC can not be the "main cause" of increase or decrease in the price of ALGO, and this is one of the main properties of the Correlation Coefficient.[[2]]