Avalanche Swaps vs Transfers (Redux)
Examine Avalanche USDC(0xB97EF9Ef8734C71904D8002F8b6Bc66Dd9c48a6E- https://snowtrace.io/token/0xb97ef9ef8734c71904d8002f8b6bc66dd9c48a6e) swaps vs transfers and mints vs burns using the new fact_event_logs data and avalanche.core.fact_traces data. Lets look at volume of USDC swaps vs transfer by hour since 7/1. - What is the average amount of USDC transferred vs swapped? - Show number of unique swapper addresses vs transfer addresses by day for USDC Next lets look at mints and burns of pairs involving - Lets look at the volume of USDC mints and burns by hour since 7/1 - How many unique wallets are minting and burning USDC by day - What is the average mint vs burn for USDC by day - Note anything else interesting about USDC transactions 75, 112.5, USDC, Ethereum
Results
A. USDC Swap vs. Transfer
A-1. Overall States of Swap and Transfer USDC
Table 1 shows the general data related to USDC swap and transfer actions on the Avalanche network from the beginning of July 2022 until the time of this report. In the 1375173 transactions, about 40B USDC were swapped, with an average of 18522 USDC swapped volume per transaction. This volume of swaps has been executed by 108214 wallets. And in 106,7074 transactions, the amount of 30B USDC was transferred between different addresses, the average transferred volume per transaction was about 22,853 USDC. This amount of transfer was done by 11,3672 addresses.
What Is Avalanche (AVAX)?
Avalanche (AVAX) is a cryptocurrency and blockchain platform that rivals Ethereum. AVAX is the native token of the Avalanche blockchain, which—like Ethereum—uses smart contracts to support a variety of blockchain projects.
The Avalanche blockchain can provide near-instant transaction finality. AVAX is used to pay transaction processing fees, secure the Avalanche network, and act as a basic unit of account among blockchains in the Avalanche network.
The Avalanche blockchain reportedly can process 4,500 transactions per second. Launched in 2020, Avalanche aims to be fast, versatile, secure, affordable, and accessible. In addition, Avalanche is an open-source project, meaning anyone can view and contribute to the platform's code [1].

What Is USD Coin?
USD Coin (USDC) is a digital currency that is fully backed by U.S. dollar assets. USDC is a tokenized U.S. dollar, with the value of one USDC coin pegged 1:1 to the value of one U.S. dollar. The value of USDC is designed to remain stable, making USDC a stablecoin.
Stablecoins are commonly backed by reserve assets like dollars or euros to achieve price stability. The price stability of USDC contrasts sharply with the notorious price fluctuations of other cryptocurrencies like Bitcoin and Ethereum [2].
Problem Definition
Look at volume of USDC swaps vs transfer by hour since 7/1:
- What is the average amount of USDC transferred vs swapped?
- What is number of unique swapper addresses vs transfer addresses by day for USDC?
Next lets look at mints and burns of pairs involving
- What is the volume of USDC mints and burns by hour since 7/1?
- How many unique wallets are minting and burning USDC by day?
- What is the average mint vs burn for USDC by day?
Definitions
Swapping Crypto
Crypto swapping is the process of conveniently exchanging crypto assets for their equivalent value in another coin or token. You can directly exchange crypto assets for another without intermediates involved in the process (like the time-consuming step of converting the asset to a fiat currency before you can get the token you prefer) [3].
Transferring Crypto
A crypto transfer on Gemini is the movement of a crypto to an external wallet or another exchange via blockchain transaction. In order to move any crypto from one place to another, you would need a “destination address” which indicates where you would like to send your crypto [4].
Minting Crypto
A crypto minting is the process of generating new coins by authenticating data, creating new blocks, and recording the information onto the blockchain through a “proof of stake” protocol. Both new units of a cryptocurrency and Non-Fungible Tokens (NFTs) can be minted this way [5].
Burning Crypto
When a cryptocurrency community decides that they want or need to destroy units of a specific cryptocurrency, they use a process called coin burning. Burning crypto is the process that effectively takes those tokens out of circulation, reducing the total supply of that coin and in some cases increasing demand [6].
Methodology
In this report, we are going to measure some important metrics for the 4 actions of swap, transfer, mint and burn USDC token in the Avalanche network from the beginning of July 2022 and visually display and investigate them.
We have divided this report into two main sections and under each main section we will refer to other sub sections:
A. USDC Swap vs. Transfer
B. USDC Mint vs. Burn
In order to extract the required data, we used the USDC token contract address: 0xb97ef9ef8734c71904d8002f8b6bc66dd9c48a6e. Meanwhile, the decimal number of the USDC token is 6. In the sense that when extracting the volume related to this token, it is necessary to divide them by 10^6, to get the real volume of USDC token.
We extracted the relevant data from the avalanche.core.fact_event_logs table and based on the values in the Event_Name and Event_Inputs columns. The method of retrieving data is as follows:
-
Swap:
First, we filtered the data of the
avalanche.core.fact_event_logstable using theEvent _Namefield and the value of'Swap'and we noticed that in the transactions found, the value of theContract _Addresscolumn is not equal to the USDC contract address (i.e.:0xb97ef9ef8734c71904d8002f8b6bc66dd9c48a6e). so :- We extracted all the records where the field
Event _Name='Swap'. - Again, we looked in the
avalanche.core.fact_event_logstable for recordes whose Tx_Hash was found in the previous step, with the condition that theirContract_Address=0xb97ef9ef8734c71904d8002f8b6bc66dd9c48a6e(the USDC contract address).
- We extracted all the records where the field
With this method, we were able to find the raw volume of the USDC token in the internal events of a Swap transaction. These raw volume were located in the Event_Inputs:value field. As stated earlier, it was necessary to divide the obtained values by 10^6 to calculate the actual value of USDC. But there was another problem.
In the process of completing a swap action and in some transactions, we noticed that the values of the Event_Inputs:value field were equally moved between different addresses. Therefore, we grouped the data of the second stage based on Event_Inputs:value and divided the obtained values by the number of occurrences of equal values. Meanwhile, in order to remove outlier data, we had to use the condition EVENT_INPUTS:value/1e6<1e9. To better understand the methodology used, take a look at the sample SQL code below:
swap as (
    select
        distinct tx_hash
    from avalanche.core.fact_event_logs
    where event_name='Swap' --Find the tx _hash of transactions that had a swap event.
),
real_swap_data as (
select
    block_timestamp,
    tx_hash,
    origin_from_address,
    event_name,
    sum(event_inputs:value) raw_volume,
    count(*) n, -- The number of occurrences of equal values of the event_inputs:value field in multiple events (event_name)
                -- that includes two events, Approval and Transfer
    raw_volume/n real_volume
from avalanche.core.fact_event_logs
where tx_status = 'SUCCESS' -- Find only successful transactions
    and contract_address = '0xb97ef9ef8734c71904d8002f8b6bc66dd9c48a6e' --USDC Contract Address
    and tx_hash in (select tx_hash from swap) -- Find only in swap transactions
    and block_timestamp >= '2022-07-01' -- Since July 2022
    and EVENT_INPUTS:value/1e6<1e9 -- Remove Outliers Data
group by block_timestamp,tx_hash,origin_from_address, event_name, event_inputs:value
)
-
Transfer: For USDC transfers, We have used
event_logstable by filtering results which theirevent_name=’Transfer’and their contract address is0xb97ef9ef8734c71904d8002f8b6bc66dd9c48a6eand are not listed among SwapTX_Hashes. -
Burn and Mints: For this part, We have used
avalanche.core.fact_event_logstable with filtering theevent_namecolumn to‘Burn’and‘Mint’and contract address to0xb97ef9ef8734c71904d8002f8b6bc66dd9c48a6e.
The data displayed in some of the charts presented in this report is based on an hour by default and the analysis presented is based on this. But it is possible for you to change the Hour _Granularity parameter and click on Apply All Parameters to apply your desired time interval in terms of hours to the charts. Note that the analysis presented is based on a 1-hour time frame, and if it changes, the analysis may not match the charts. You need to login to change Hour_Granularity parameter.
The six donuts below have compared the Number of Transactions, the Number of Addresses and the Volume of USDC on the two actions of Swap and Transfer. The three donuts on the left are drawn based on the selected Hour_Granularity parameter (1 hour by default) and the three donuts on the right are drawn based on the daily time frame. Note that by changing the Hour_Granularity parameter to 24 hours, the data on the left graphs will be the same as the data on the right. In all six graphs, it can be seen that the values of these three metrics were higher in the swap action than in the transfer.
A-2. Comparing Swap and Transfer USDC Metrics on the Overtime
The figures below show the changes in the number of transactions, the number of unique users (addresses) and the volume of USDC swapped and transferred from the beginning of July 2022 until the time of this report. The charts on the left are based on Hour_Granularity time frame and the charts on the right are the same as the charts on the left, except that their time frame is daily.
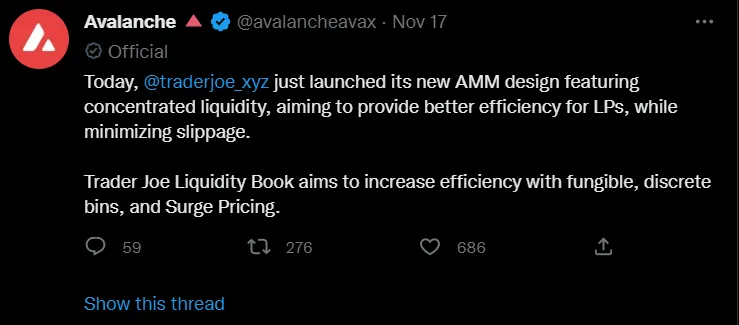
Referring to graph 1-2, we can see that the number of transactions related to swaps and transfers reached its peak on November 8, 9, and 10. The cause of this issue can be related to the collapse of the FTX exchange. Here [7]’s a timeline of FTX’s collapse. 8 November, the FTX tokens (FTT) price COLLAPSE BEGINS [8]. On November 18, we see another peak in transfer transactions, the reason of which can be found in the launch of a new design of AMM in the TraderJoe project and on the Avalanche platform [9].
It seems that in the rest of the days, the number of transactions of these two actions had their natural trend.
Two graphs 1-2 and 2-2 depict the trend changes in the presence of the addresses of participating wallets in the USDC swap and transfer.Chart 2-2 shows a large volume of wallets for USDC swaps on December 3, 2022. The reason can be related to the news (APAC's largest cloud service provider, Alibaba Cloud, has expanded support for #Avalanche) [10].
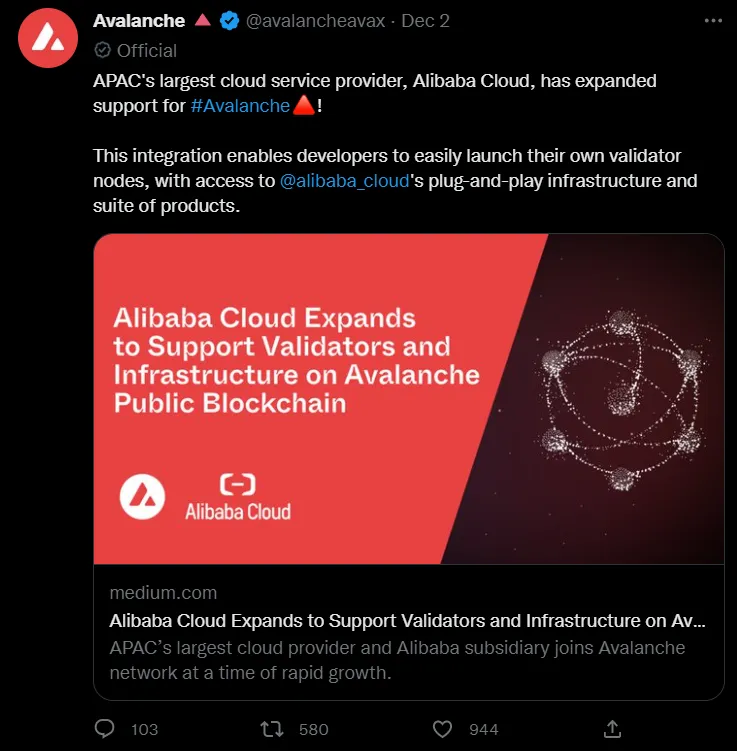
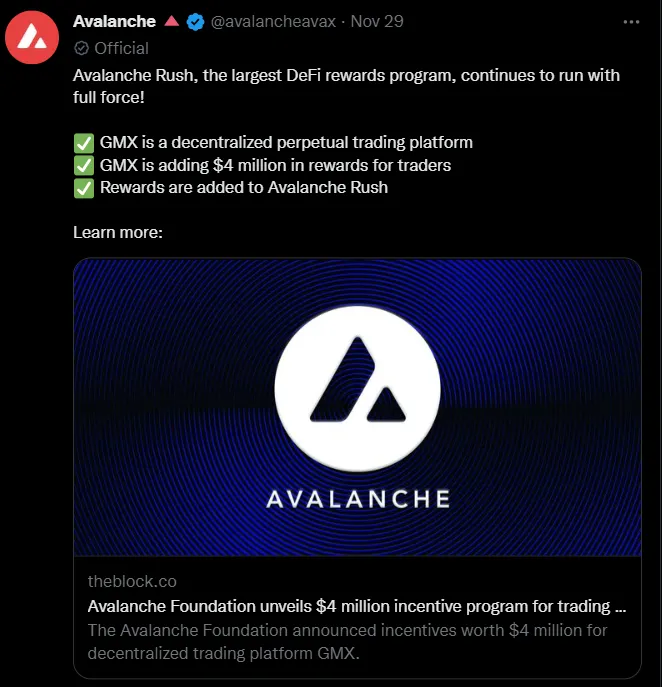
Chart 3-2 shows that on November 15, 2022, a volume of about 1.7B USDC tokens was swapped. The reason for this can be seen in the news of the payment of 4 million dollars rewards to traders by the GMX protocol and the addition of rewards to Avalanche Rush [11].
On July 28, 2022, we also see a huge amount of USDC transfer (about 1.5B), which may be due to this news [12] that USDC on avalanche is available for purchase via Ramp Network.
Charts 4-1 to 6-2 compare the average, median, and maximum values of three aggregators related to the volume metric for the two actions of swap and transfer. The value of the minimum aggregator in this metric was equal to zero.
A-3. Comparing Swap and Transfer USDC Metrics Ratio on the Overtime
The 4 charts below compare the ratio of the four metrics of number of transactions, number of unique wallets, volume and average volume of USDC in two Swap and Transfer actions. In all four figures below, we can see that over time and most of the time, the proportion of metrics related to the Swap action is greater than Transfer action. These four charts are displayed on an hourly basis. If you wish, you can view the graphs on a daily basis by changing the value of the Hour_Granularity parameter to 24 hours and get the results you want.
A-4. Tops Wallet Addresses in Swap and Transfer Metrics
The following 4 donuts are respectively related to:
- Comparison of the number of transactions of the top ten wallets in the implementation of the USDC swap action
- Comparison of USDC volume swapped by top ten wallets
- Comparison of the number of transactions of the top ten wallets in the implementation of the USDC transfer action
- Comparison of the volume of USDC transferred by the top ten wallets
A-5. Swap and Transfer Volume Distribution
As you can see in charts 11-1 and 11-2, we have distributed the number of transactions related to USDC Swapped Volume into 10 categories based on the volume of swap.
Chart 11-2 shows that most of the transactions of USDC swaps had a volume equal to 100 to 1000 USDC (517.182K transactions with a ratio of 38% to the total number of Swap transactions, with about 199M swapped USDC volume, that includes only 0.5% from total swapped volume), meanwhile, the largest volume of USDC swapped is in the category of more than 1,000,000 USDC volumes (with a volume of 37B, which is equivalent to about 93% of the total swapped volume. This volume was swapped with 4574 transactions, that is, only with 0.34% of the total number of swap transactions).
B. USDC Mint vs. Burn
B-1. Overall States of Mint and Burn USDC
Table 1 shows the general data related to USDC mint and burn actions on the Avalanche network from the beginning of July 2022 until the time of this report. In the 1435 transactions, about 1.2 B USDC were minted, with an average of 835902 USDC minted per transaction. This volume of minted has been executed only by 2 wallets. And in 4149 transactions, the amount of 1.8 B USDC was burned and the average burned volume per transaction was about 427157 USDC. Again, this amount of burn was done by only 2 addresses.
The four charts below show a visual comparison of some of the metrics listed in Table 1 by USDC swap and transfer action.
The four charts below show a visual comparison of some of the metrics listed in Table 2 by USDC mint and burn action.
The six donuts below have compared the Number of Transactions, the Number of Addresses and the Volume of USDC on the two actions of Mint and Burn. The three donuts on the left are drawn based on the selected Hour_Granularity parameter (1 hour by default) and the three donuts on the right are drawn based on the daily time frame. Note that by changing the Hour_Granularity parameter to 24 hours, the data on the left graphs will be the same as the data on the right.
The first two donuts show that the average number of transactions taking the Burn action is higher than Mint USDC.
Due to the fact that only two wallets participate to perform Burn and two other wallets participate to perform Mint USDC, so the average of the number of wallets involved in performing these two actions (according to the two donuts below) will be equal.
The two figures below also show that the average volume of USDC burned either in one hour (by default) or in one day is more than the average volume of this token being minted.
B-2. Comparing Mint and Burn USDC Metrics on the Overtime
The figures below show the changes in the number of transactions, the number of unique users (addresses) and the volume of USDC minted and burned from the beginning of July 2022 until the time of this report. The charts on the left are based on Hour_Granularity time frame and the charts on the right are the same as the charts on the left, except that their time frame is daily.
Referring to graph 13-2, we can see that the number of transactions related to mint reached its peak on July 28, 2022, which may be due to this news [12] that USDC on avalanche is available for purchase via Ramp Network.
The general trend of Burn USDC, both hourly and daily time frame, except for the discussed peak, is almost constant and is fluctuating in a certain range.
The number of Mint transactions has increased significantly on August 4, 2022, if the reason is not clear by searching the official Twitter of the Avalanche network. The sudden increase in the number of Mint transactions on this date is not directly related to the volume of Mint (see the chart 15-2).

As mentioned earlier (according to Table 2), only 4 addresses participate in Mint and Burn actions (two addresses for each action), which shows trend of activity of these two wallets over time (one hour (by default) and daily time frame) in diagrams 14-1 and 14-2. As these two graphs show, the trend and the number of wallets present for these two actions are stable over time and most of the time.
In the explanation of diagram 13-2, it was stated that due to the start of acceptance of purchases in the Ramp network with native avalanche USDC, we may have had a peak in the number of transactions related to the Burn action on July 28, 2022. You can see the volume resulting from the execution of this number of transactions in diagram 15-2. This volume of transaction has created a peak in burned USDC volume on this date. In a way, this event caused the Minted USDC Volume to increase on this date, although the number of minting transactions was at its normal number (see the chart 13-2).
Charts 16-1 to 18-2 compare the average, median, and maximum values of three aggregators related to the volume metric for the two actions of mint and burn . The value of the minimum aggregator in this metric was equal to zero.
B-3. Comparing Mint and Burn USDC Metrics Ratio on the Overtime
The charts 19 to 22 compare the ratio of the four metrics of number of transactions, number of unique wallets, volume and average volume of USDC in two Mint and Burn actions. In figures below, we can see that over time and most of the time, the proportion of metrics related to the Burn action is greater than Mint action.
In diagram 19, we can see that over time and in the daily time frame, the ratio of the number of Burn transactions is more than the number of Mint transactions int the most of time. You can see the same comparison regarding the metric of the number of wallets running Mint and Burn in chart 20. It seems that the ratio of these two to each other is more inclined to 1 (they are equal). In chart 21, we see that over time and most of the time, the ratio of the average volume of burned USDC is higher than the volume of minted. But this ratio is the opposite regarding the metric of average volume burned to minted (Chart 22) and we can see that the ratio of average volume minted over time is more than the average volume burned.
B-4. Comparing Wallet Addresses in Mint and Burn Metrics
According to the four cakes below, we can see that only two of the four participating addresses in Mint and Burn actions have a very active presence in these two operations and almost 100% of these two activities are carried out by these two wallets:
For Mint: ‘0xce3c97a4e1b8b19304fe6cf091e3f5c906533004’
For Burn: ‘0xbf14db80d9275fb721383a77c00ae180fc40ae98’
B-5. Mint and Burn Volume Distribution
As you can see in charts 23-1, we have distributed the number of transactions related to USDC mint into 10 categories based on the volume of mint. Chart 23-1 shows that most of the transactions of USDC mint had a volume equal to 10,000 to 100,000 USDC (with 479 transactions, which includes about 33% of all transactions, with about 19.7M volume of Minted USDC, that includes 1.63% from all minted volume).
Meanwhile, by referring to Chart 23-2, we see that the largest volume of minted USDC is in the category (>=1,000,000) with a volume of about one billion USDC. This volume accounts for about 85% of the total volume of minted USDC. This volume has been minted by executing 191 transactions, which includes about 13.2% of all transactions.
Conclusion
In this research, we retrieved several metrics to compare four measures of Swap vs. Transfer and Mint vs. Burn USDC from the data in the tables related to the Avalanche scheme in the large database Flipsidecrypto.xyz and compared and explained them visually. We tried to determine the reason for the occurrence of different peaks in different metrics by referring to the official pages of the Avalanche network on Twitter and mention them in the report. The metrics studied are: number of transactions, number of unique addresses, volume of USDC, average, median and maximum aggregators, distribution of number of transactions according to transaction volume. These metrics were compared in two time frames, hourly (by default) and daily. Although it was possible for users to change the time period up to 24 hours by changing the Hour_Granularity parameter.
The general points that can be mentioned in this research are:
Swap vs. Transfer:
- Metrics related to swaps were at a higher level of transfer USDC.
- The news resulting from the changing market conditions and the creation of special facilities in the Avalanche network have had a significant impact on the creation of spikes in various Swap and Transfer USDC metrics.
- Most of the transactions related to USDC swap and mint in Avalanche had a volume between 100 and 1000 USDC, While the actual volume of these two actions is in the tenth category of distribution (i.e. more than 1,000,000 USDC).
Mint vs. Burn
- Most of the metrics related to Burn action are higher than Mint (except the average volume minted).
- The only two active wallets in the field of minting and burning USDC have been the most active on the Avalanche network (one address per action). Although two other addresses were also observed in the data output, but the metrics related to these two addresses tend to be zero.
- The published news related to the change in the conditions in the cryptocurrency market as well as the changes in the Avalanche network and the active protocols in it have also affected the values of the metrics studied in the two actions of Mint and Burn, but it seems that this effect is less than the two actions of Swap and Transfer USDC.
- Most transactions related to USDC minting have a volume between 10,000 and 100,000 USDC, while most transactions related to burning USDC have a volume between 100 and 1,000 USDC. Meanwhile, the actual volume of these two actions is in the tenth category of distribution (i.e. more than 1,000,000 USDC).
Chart 12-1 shows that most of the USDC transfer transactions had a volume between 100 and 1000 USDC (the number of 361,573 transactions, which accounted for about 34% of the total transfer transactions, with about 128.5 M transferred USDC volume, that includes only 0.43% from total transferred volume), while the most The volume of transferred USDC is in the (>=1,000,000) USDC category (with a volume of about 21.8 B, which is 72.25% of the total volume transferred- chart 12-2). This transfer volume occurred with 5170 transactions, which is only 0.38% of the total transactions.
Chart 24-1 shows that most of the transactions related to burning USDC have a volume between 100 and 1000 USDC (1222 transactions, which is about 29% of the total transactions, with about 471K volume, that includes 0.03% from total burned volume), while referring to Chart 24-2 We notice that the highest volume of USDC burned is in the category (>=1,000,000). This category has a volume of about 1.6 B, which accounts for 88.32% of the total volume of USDC burned. This volume of burning USDC happened with the execution of 238 transactions, which includes about 5.7% of the total transactions.