NEAR On Chain Data Report: Before vs. After ATL
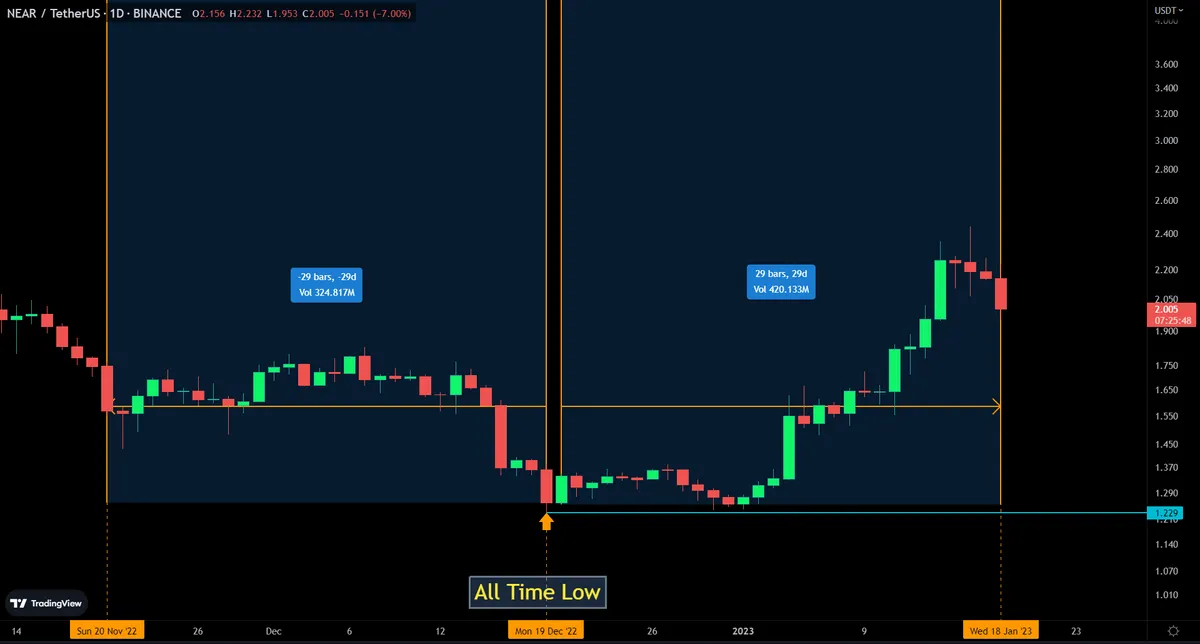
On 2022-12-19, NEAR recorded its lowest price ($1.229) in the market and experienced a new ATL (All Time Low). After this date and according to the conditions in the market, it was able to have a good price growth (up to $2.442). The time interval from 2022-12-20 to 2022-01-18 is equal to 29 days. In this report, we tried to compare the metrics discussed in this research in two equal time periods Before (-29 days) and After (+29 days) ATL date.
Introduction
Each week, the NEAR Foundation publishes data to help the NEAR community understand the ecosystem's health as part of their Transparency Report. So, We want your help in making the NEAR ecosystem even more transparent.
For this purpose and based on the occurrence of an ATLD (All Time Low Date) in this crypto on 2022-12-19, We considered two time periods of 29 days Before vs. After ATLD and We calculated and compared our desired metrics in these two periods (See the image below for more details). The before ATLD period starts from 2022-11-20 and ends on 2022-12-19, and the after ATLD period starts from 2022-12-20 and ends on 2023-01-18.
Definitions and Metrics
Metrics
In order to show the transparency and health of the NEAR network, we identified and measured the metrics of the number of transactions, gas used, transaction fees, new addresses (wallets/users), active addresses, new contracts, and active contracts in two defined time periods.
- Transactions: A
Transactionis a collection ofActionsthat describe what should be done at the destination (thereceiveraccount) [2]. - Gas and Fee: On every transaction you send to the network NEAR charges you a fee (aka gas fee). This fee is used to indirectly pay the people that keep the network infrastructure, and to incentivize developers of smart contracts [3].
- New Address: A new crypto wallet address has no previous history of transactions [4].
- Active Address: An wallet address that has at least one transaction in the defined time period (in this research in one day) [5].
- New Contract: Smart contracts are simply programs stored on a blockchain that run when predetermined conditions are met. They typically are used to automate the execution of an agreement so that all participants can be immediately certain of the outcome, without any intermediary's involvement or time loss [5].
- Active Contract: A contract that has at least one execution in the defined time period (in this report in a day).
Definitions
- ALL Time Low (ATL): It’s the lowest trading price a cryptocurrency has ever reached[7].
- BA-ATLD: Before vs. After All Time Low Date
- B-ATLD: Before All Time Low Date
- A-ATLD: After All Time Low Date
Results
Number of Transactions
Chart 1 shows the trend of the number of transactions executed in two defined time periods. It can be seen that the trend of the number of transactions after ATLD was upward, but the total number of transactions executed before ATLD (about 10.4 million transactions) was more than after ATLD (about 9.9 million transactions). The difference in the number of transactions executed in these two time periods is 1.2%.
Gas Used (Peta)
Graph 2 compares the trend of gas used in the two studied periods. In this graph, we can see that the general trend of the gas used from the beginning of the period before ATLD until 2023-01-07 is downward, and after that we see an increase in this metric, so that on January 12, a peak with a value of about 2020.5 created. The pie chart below shows that gas used before ATLD is more than after this date. The gas used in B-ATLD is about 55102 and the in the A-ATLD is about 45160, which is about 10% less than the B-ATLD.
In graph 3, we can see that the average gas used after ATLD and on December 31, 2022 created a peak with about 20.3 microns. It is interesting to know that the minimum average gas used per day also occurred after ATLD on January 12 with a value of 13.72 microns. In the donut chart below, we can see that the average gas used in the entire period after ATLD is about 4.2% lower than before ATLD.
Fee
Considering the direct relationship between the amount of gas used and the amount of fee taken from the addresses, we see that the trend of graph 4, which is related to the comparison of transaction fees in the two studied time period, is the same as graph 2. The peak amount of the fee received (about 234.5k) occurred on November 21, 2022, while the minimum fee in the period after ATLD is recorded on 2023-01-01 with the amount of 116.6k. The total fee obtained after ATLD was about 4413k, which shows a %10 decrease compared to before ATLD.
Unlike the sum of fee per day in the previous chart, in the daily chart below we can see that the average fee after ATLD and on December 31 has recorded its maximum value (about 0.002). However, the average fee before ATLD with a value of about 0.00184 is more than ATLD with a value of about 0.00169 (4.2% higher).
New Addresses
Chart 6 clearly shows that the market conditions and the increase in the price of the NEAR token have been able to have a positive effect on attracting users (creating new wallets) and registering transactions in this network. In the period after ATLD, the trend of new addresses has been completely upward, and on 2023-01-13, the highest number of unique addresses was recorded with a 38,135k wallets. The total number of new wallets in A-ATLD was 345,467, which is 6.8% more than the B-ATLD period.
You can also see the cumulative trend of the number of new addresses in chart 7. Seeing the higher values and larger circles of the number of new addresses after ATLD confirms the situation observed in the donut chart below.
Active Addresses
What we see in chart 8 regarding the number of active addresses during the two comparative periods is similar to chart 6 (new addresses), so that we see an increasing trend in the number of active wallets after ATLD.
In the peak of this graph, we can see that 149.2 thousand users were active on January 13, 2023. It is necessary to know that the minimum number of active users also occurred during the same period and on December 31, 2022 (35.12 k wallets).
The pie chart below shows that 1742122 addresses were active in A-ATLD, which shows a 5% increase compared to the B-ATLD period.
The following graph also compares the cumulative amount of active wallets in the NEAR network in two time periods. In A-ATLD, we can see that the slope of the graph has suddenly increased, which indicates an increase in the number of active wallets address.
Charts 10 and 11 show the ten most active addresses in the NEAR network during two ATLD periods. The address of Oracle Sweat is in the first rank in terms of the number of transactions. Based on chart 10, we can see that the number of transactions of this address in B-ATLD was more than A-ATLD, so that after ATLD it decreased by 10.124%.
Diagrams 10 and 11 show that there are two addresses with rank 9, each of which was active only in one of the two periods. Tron-1.NEAR address was active only in A-ATLD and OPERATOR.ORDERLY-NETWORK.NEAR only in B-ATLD.
New Contracts
In diagram 12, you can see the status of creating new contracts over time and during the two studied periods. The peak of this chart occurred before ATLD and on 2022-12-04 with the number of 42 new contracts, and then the general trend of creating new contracts has been downward. The total number of new contracts in A-ATLD was 182, which represents a decrease of 24% compared to the B-ATLD period.
.
Chart 13, which has drawn the cumulative sum of new contracts over time, clearly shows that before ATLD, along with a sudden break in the slope of the chart (after December 1st), it formed circles with larger areas, indicating a sudden increase in the number of contracts.
Active Contracts
Figure 14 shows the number of executions of active contracts during the two periods before and after ATLD and based on success or failure in execution in the form of a Scatter diagram and on a daily basis. Larger circles at a higher level indicate successful and smaller circles at a lower level indicate unsuccessful execution of contracts.
The peak number of contract executions in successful status before ATLD occurred on 2022-12-15 (745 executions). In the same situation, the most number of failed executions of contracts happened before ATLD with the number of 218 executions on 2022-12-13.
Chart 15 has compared the rate of contract execution based on successful and unsuccessful status during the study period.
The most successful rate of execution of active contracts with the amount of 81.6% occurred on December 11, 2022, and the most rate of unsuccessful execution of active contracts with the amount of 25.4% also occurred on 2022-12-13.
Chart 16 also compares the cumulative total of the implementation of active contracts during the two studied periods.
The total number of successful active contracts before ATLD was 17,664k, while in the same period after ATLD and based on the same metric, the number reached 17,383k (It was about 1.62% more). The total number of failed contracts before ATLD has reached 5047, which has only three more failures than in the period after ATLD.
In the last step, we tried to identify the top ten active contracts based on the number of executions separately for each period before and after ATLD, which you can see in the two beautiful pie charts below.
In the diagram on the left, which is related to B-ATLD, we see that the contracts app.l2e.near, fnf-club.collections.fewandfar.near, 11.v1.cellfi-prod.near, 21.app10.hipodev.near and anniversary.paras.near are in the first to fifth ranks respectively. In this graph, we can see that 24.1% of the total execution of these top 10 contracts is related to the first rank contract (i.e. app.l2e.near).
But in A-ATLD, the contracts v1.tonic-perps.near, 66.app10.hipodev.near, farmnear.near , 77.app10.hipodev.near and main.welott.near are ranked from 1 to 5 respectively, that only the first contract (i.e. v1.tonic-perps.near) accounted for 76% of the total executions of these top ten contracts.

Near Protocol
NEAR Protocol is a smart contract capable, public Proof-of-Stake (PoS) blockchain that was conceptualized as a community-run cloud computing platform. Built by the NEAR Collective, NEAR was designed to host decentralized applications (dApps), and strives to compete with Ethereum and other leading smart contract-enabled blockchains like EOS and Polkadot. NEAR’s native token is also called NEAR, and is used to pay for transaction fees and storage [1].
Conclusion
In this study, we investigated the status of some important cognitive metrics related to the world of blockchains, such as the number of transactions, gas used, fees, new users, etc., in the high-speed and powerful NEAR network. This study is done in a comparative way between two equal time periods Before and After ATLD and the results are as follows:
- The # of Transactions, Gas Used and Fees (in the Sum and Average) in the B-ATLD were more than A-ATLD.
- The # of New and Active Addresses in the A-ATLD are more than B-ATLD.
- The # of New Contracts in the B-ATLD was more than A-ALTD
- The # and Rate of execution of Active Contracts (both successful and unsuccessful) in the B-ATLD was higher than A-ALTD.
Discord: Mercury#8660
Twitter: Pirooz Trader