Polygon Block Performance
What is the average time between blocks in Polygon? 75,225,B,USDC-ETH
What is a Block (Blockchain Block)?
Blocks are data structures within the blockchain database, where transaction data in a cryptocurrency blockchain are permanently recorded. A block records some or all of the most recent transactions not yet validated by the network. Once the data is validated, the block is closed. Then, a new block is created for new transactions to be entered into and validated.
A block is thus a permanent store of records that, once written, cannot be altered or removed. [1]
What is in a Block?
According to Ethereum official documentation many data are recorded in a block, but what we will need in this report includes the following:
timestamp– the time when the block was mined.blockNumber– the length of the blockchain in blocks.[2]
BLOCK TIME
Block time refers to the time it takes to mine a new block. In Ethereum, the average block time is between 12 to 14 seconds and is evaluated after each block. The expected block time is set as a constant at the protocol level and is used to protect the network's security when the miners add more computational power. The average block time gets compared with the expected block time, and if the average block time is higher, then the difficulty is decreased in the block header. If the average block time is smaller, then the difficulty in the block header will be increased.[2]
BLOCK SIZE
A final important note is that blocks themselves are bounded in size. Each block has a target size of 15 million gas but the size of blocks will increase or decrease in accordance with network demands, up until the block limit of 30 million gas (2x target block size). The total amount of gas expended by all transactions in the block must be less than the block gas limit. This is important because it ensures that blocks can’t be arbitrarily large. If blocks could be arbitrarily large, then less performant full nodes would gradually stop being able to keep up with the network due to space and speed requirements.[2]
BLOCK PERFORMANCE
Performance of blockchain networks is generally measured as the average time it takes for a transaction to be validated and stored in each peer node in a way that it cannot be reversed or revoked.[3]
Methodology
According to the above definitions, in this article we are going to compare the performance of the POLYGON network with other first layer networks such as Ethereum, Solana, Flow, etc. and second layer networks such as Optimism, Arbitrum, etc.
Note: Before We want to go into the working method, it is necessary to say something about the time calculation between two blocks. The time we consider for registering a block in the blockchain is related to the time a block is mined (that is, at the end of creating a block). Therefore, the duration of forming a block will be equal to the difference between the time recorded for the CURRENT block and the time recorded for the PREVIOUS block. In addition, each block has only one timestamp.
To achieve these goals, we took the following steps for 11 networks so that we could make a good and at the same time comprehensive comparison:
For Minimum, Maximum and Average Metrics
- We grouped the data in the
transactiontable of each network based onBlock_Number(orBlock_Hight,Block_ID) andBlock_Timestampand counted the number of transactions in each block. - In the second step, we calculated the time difference between the current block and the previous block. To realize this step, we first extracted the
block_timestampvalue of the previous record (previous block) using the LAG function and extracted the time difference of two consecutive blocks using theDiffDatefunction in milliseconds:
SELECT LAG(BLOCK_TIMESTAMP,1) OVER (ORDER BY BLOCK_NUMBER ASC) Previous_Block_Timestamp,
    DATEDIFF('millisecond',Previous_Block_Timestamp,BLOCK_TIMESTAMP) DIFF_DATE
From ...
- In the third step, we extracted the maximum and minimum recorded time between two blocks, average, minimum and maximum number of transactions are done in a block.
- We did union all the results obtained in the third stage for 11 networks.
For First Minimum and Maximum Occurrences
- Exactly like the first step mentioned above.
- We sort the results of the first step in ascending order and send the first record with the Minimum/Maximum number of transactions to the output.
Results
Minimum, Maximum and Average Metrics
By implementing the aforementioned method on the transaction table of 11 blockchains (L1 and L2), we will reach the results shown in Table 1. You can see that the minimum time recorded in the Solana network between two consecutive blocks is negative!!!, meanwhile, for some other networks this minimum time is zero.
It is very likely that the reason for the negative minimum recorded time for Solana network is due to data disruption in the transaction tables of this network so that the current block recorded time is less than the previous block recorded time. Another reason can be due to the disturbances in the functioning of the Solana network. Zero values for some networks, for example Optimism, Flow, and Algorand, indicate blocks that were added at one time (most likely in less than 1 millisecond) to the blockchain's blocks.
Note: This negative value has been observed only once. Therefore, in Table 2, by applying the condition:
Where previous_Block_Timestamp < Current_Block_Timestamp
We extracted negative and zero values from the results and reached the results in Table 2.
The minimum time recorded between two blocks in some networks, which is equal to zero, is logically acceptable, however, the data in Table 2 is cited in the rest of the report.
The following can be inferred based on the results shown in Table 2 and Figures 1 to 5:
- Since the shorter the minimum time recorded between two blocks indicates the high speed and efficiency of the network, therefore Polygon network receives the 9th rank among 11 networks in this item. In this column Near is in the first place.
- The topic of the previous paragraph is also true regarding the maximum time recorded between two blocks, so the Polygon network ranks second in this metric and Optimism is in the first ranking.
- The average number of transactions performed in one block in the Polygon network is equal to 75.65 and it ranks 5th in this regard. Solana is the first place in this column.
- The minimum number of transactions that the Polygon network was able to record in one block was 1, and in this regard, it ranks second next to other networks such as Optimism, Ethereum, Solana, etc. The interesting point is that the BSC network has not penetrated the minimum number of transactions recorded in each block to less than 15.
- The maximum number of transactions that Polygon network was able to record in one block was 1332 units and it is ranked 4th in this metric. In this metric Algorand is in the first place.
In the following, you will see the visual results from Table 2. In order to better compare the results, we have used Bar figures.
First Minimum and Maximum Occurrences
Figure 6 and 7 shows the First Block Recorded with the Minimum Transactions for 11 blockchains. As mentioned, the Binance Smart Chain network shows the most efficiency by executing at least 15 transactions (regardless of the duration of the execution of this number of transactions) in the 19094336-block number (Figure 6) and 2022-06-28 21:49:25.000 timestamp (Figure 6 and 7).
Note: Toggle the colored bullets in the legend section to better match bars with block numbers and timestamps.
Figure 8,9 and 10 shows the First Block Recorded with the Maximum Transactions for 11 blockchains. As mentioned, the Algorand network shows the most efficiency by executing about 5000 transactions (regardless of the duration of the execution of this number of transactions) in the 17758402-block number (Figure 8) and 2021-12-01 09:28:13.000 timestamp (Figure 9). Algorand has been able to perform 4998 transactions within 5000 milliseconds (Figure 10). As mentioned before, Polygon ranks 4th in this criterion.
Calculation of Maximum Power
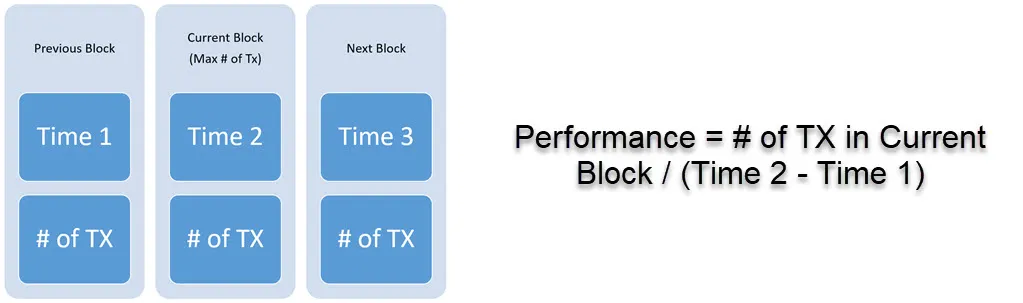
One of the appropriate criteria for measuring the performance of blocks in a blockchain is the execution of the maximum number of transactions in the shortest possible time (Maximum Power). Therefore, the events of executing the maximum number of transactions are of particular importance. In order to more accurately measure the efficiency of the networks, we decided to divide the maximum number of transactions in each network by the difference between the time interval of the current block (with maximum number of transactions) and the previous block to reach (the number of transactions per milliseconds). Refer to the image below for a better understanding of this action.
Figure 11 shows results. This chart shows that Arbitrum has the ability to perform 128 transactions in one millisecond and has been higher efficiency than other networks. Polygon ranks 10th in this criterion. Solana network is ranked second and BSC network is in the last place.
Note: The colored bullets in the legend section of the chart are the time difference between the current (with the maximum number of transactions) and the previous block.
Conclusion
In this research, we wanted to compare the performance of Polygon network with other layer 1 and layer 2 networks. This comparison was supposed to be made based on maximum and minimum recorded time between two blocks and number of transactions are done in a block on average. We also added the maximum and minimum number of transactions that are done in a block to the set of results of this research and finally defined a concept called Maximum Power and calculated it as well.
In addition, in order to display the results better, we had to clean the data in the aforementioned way.
The networks that we compared with the Polygon network in this report included the following blockchains:
Ethereum, Solana, Flow, Near, Binance Smart Cain, Terra, Optimism, Arbitrum, Osmosis and Algorand.
We obtained interesting results in this research:
- Polygon receives the 9th rank among 11 networks in the Minimum Recorded Time Between Two Blocks (Figure 1).
- Polygon ranks second in the Maximum Recorded Time Between Two Blocks (Figure 2).
- The average number of transactions performed in a block in the Polygon network is equal to 75.65 and it ranks 5th in this regard (Figure 3).
- The minimum number of transactions that the Polygon network was able to record in one block was 1, and in this regard, it ranks second next to other networks such as Optimism, Ethereum, Solana, etc (Figure 4).
- The maximum number of transactions that Polygon network was able to record in one block was 1332 units and it is ranked 4th in this metric. In this metric Algorand is in the first place (Figure 5).
- Binance Smart Chain network shows the most efficiency by executing at least 15 transactions (regardless of the duration of the execution of this number of transactions) in the 19094336-block number (Figure 6) and 2022-06-28 21:49:25.000 timestamp (Figure 6 and 7).
- Algorand network shows the most efficiency by executing about 5000 transactions (regardless of the duration of the execution of this number of transactions) in the 17758402-block number (Figure 8) and 2021-12-01 09:28:13.000 timestamp (Figure 9). Algorand has been able to perform 4998 transactions within 5000 milliseconds (Figure 10). As mentioned before, Polygon ranks 4th in this criterion.
- Arbitrum has the ability to perform 128 Transactions in a Millisecond (Maximum Power) and it has higher efficiency than other networks. Polygon ranks 10th in this criterion. Solana network is ranked second and BSC network is in the last place.