Optimistic Bears
Q9. Analyze Optimism during the month of July as markets were get turbulent, showing whatever metrics you care to unearth.

Table of contents:
- Introduction
- Methodology
- How did the Optimism network perform during July?
- The new users of Optimism during June and July.
- Transactions on Optimism on different platforms.
- Conclusion.

-
Introduction:
In this dashboard, I will deal with the proposed questions in the Optimistic Bears bounty -i.e. You can choose any topic you’d like: How did the network perform? What about market performance? Were there significant inflows or outflows on bridges? Were there any notable patterns in user behaviour?-, but to understand the answers, we should know that Optimism is a layer 2 to Ethereum main net, which speeds up Ethereum transactions and cuts their costs by settling them on another blockchain using advanced data compression techniques (RobertStevens_27Apr2022; Ethereum.org). Optimism helps Ethereum users save on gas fees by rolling up batches of transactions, using a technology known as optimistic rollups (RobertStevens_27Apr2022).
- Methodology:
I wrote three queries -i.e. How did the Optimism network perform during July?; The new users of Optimism during June and July.; Transactions on Optimism on different platforms- and here I will discuss the used tables for each.
How did the Optimism network perform during July?
For this query, I used optimism.core.fact_transactions table.
The new users of Optimism during June and July.
For this one, I used optimism.core.fact_transactions like the previous query.
Transactions on Optimism on different platforms.
for this one, I used “join” and used two tables, which are optimism.core.dim_labels and optimism.core.fact_transactions.
- How did the Optimism network perform during July?
- The new users of Optimism during June and July
- Transactions on Optimism on different platforms
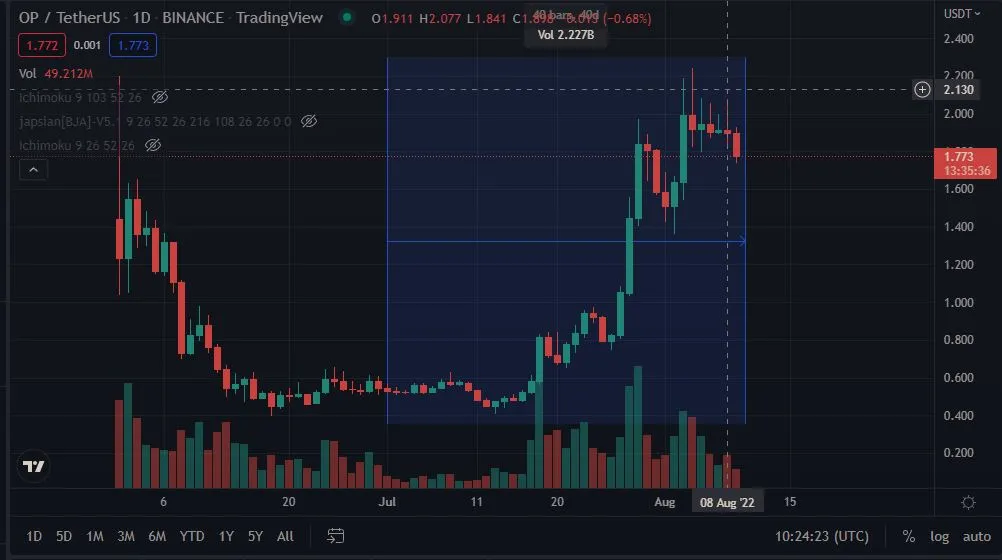
OP price, Trading view, from the 1st of July to the 8th of August.
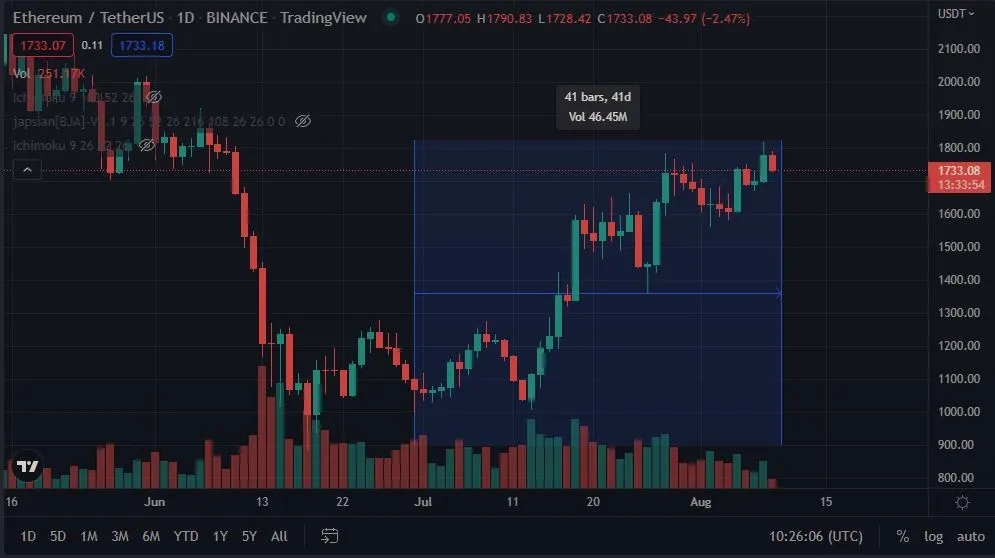
ETH price, Trading view, from the 1st of July to the 8th of August.
The presented table and charts and also the chart of OP and ETH prices demonstrate that in July, the increase of the ETH and OP prices resulted in an increase in Optimism chain usage by users.
Like the previous question and its charts and table, these charts and tables also show an increase in the usage of the Optimism chain and also it increased the number of new users of this chain.
This table and charts show that in July, when the price of OP and ETH was increasing, people mostly used the dexs concerning the Optimism chain.

- Conclusion:
This Dashboard showed that when the price of coins in the market was going up, the prices of OP and ETH were also going up. The number of new users and usage of the Optimism chain shows that in this market, this chain and its token attracted a lot of attention which shows the bright future of this chain.