A Surge of Optimism
The price of Optimism (OP) fell sharply in early November, dropping from highs above $1.30 on November 6 to as low as $0.79 on November 9. In the weeks since, prices have been on the rise, with OP hit $1.19 on December 14. Analyze the network and diagnose some of the possible reasons for the sudden drop, and slow climb, of OP price in recent weeks. Are there any notable trends in users, transactions, or any other metrics that could explain these events? Note any patterns or outliers you see.

WELCOME TO OPTIMISM ENVIRONMENT!
INTRODUCTION TO OPTIMISM 101
For the beginning, explanation of the terminology and Optimism is important!
- Optimism: a Layer 2 scaling solution for Ethereum that can support all of Ethereum's Dapps. Instead of running all computation and data on the Ethereum network, Optimism puts all transaction data on-chain and runs computation off-chain, increasing Ethereum's transactions per second and decreasing transaction fees.
- Ethereum: a decentralized blockchain platform that establishes a peer-to-peer network that securely executes and verifies application code, called smart contracts.
- OP: the cryptocurrency for used Optimism platform.
INTRODUCTIONS
- INTRODUCTION!
- PRICE TREND ANALYSIS(ETH VS OTHER CRYPTOCURRENCIES)
- DAILY VOLUME
- MOVING AVERAGE
- OP PRICE GAIN/LOSS RATIO
- RSI
- ENDING
METHODOLOGY
- Except RSI, all of the charts are built by Flipside databases.
- ==For the price analysis,== the
optimism.core.fact_hourly_token_pricestable used. Some of the ERC-20 tokens, the table is the same. But some of the token prices are gathered from theirfact_pricestables. The price trend starts from the beginning of November. - ==For the volume analysis,== the
optimism.sushi.ez_swaps, optimism.velodrome.ez_swapsand eth swap tables are used. - ==For the MA,==
optimism.core.fact_hourly_token_pricestable is used. More information will be given on the section.(Moving Average) - ==For gain/loss ratio==,
optimism.core.fact_hourly_token_pricestable is used. More information will be given on the section.
PRICE TREND ANALYSIS (OPTIMISM VS OTHER CRYPTOCURRENCIES)
DAILY VOLUME ANALYSIS
MOVING AVERAGE ANALYSIS
$OP PRICE GAIN/LOSS RATIO
RSI (REPETITIVE STRAIN INJURY)
ENDING
OVERALL: PRICE
> (We will use All Else Equals understanding for sections)
- As we know, Optimism is a layer 2 platform that build on Ethereum blockchain environment. Therefore, the falls and ups on Ethereum may affect the price of Optimism.
- To improve this assumption: charts at the above show that the Optimism prices are showing the same characteristics with Ethereum prices and other some of the ERC-20 tokens.
- We can say that there was an event on the first days of November and kept until the starting of December: which effected most of the cryptocurrencies.
OVERALL: MOVING AVERAGES
> (We will use All Else Equals understanding for sections)
-
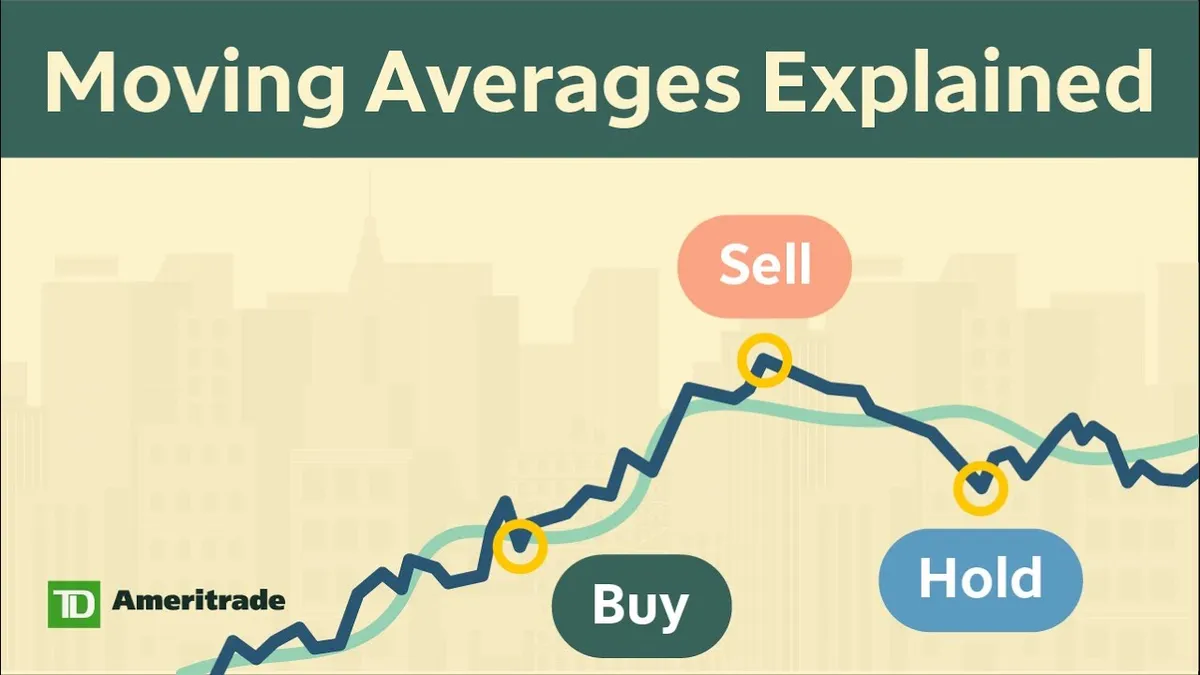
A moving average (MA) is an indicator commonly used in technical analysis. The moving average helps to level the price data over a specified period by creating a constantly updated average price. Moving averages are calculated to identify the trend direction of a stock or to determine its support and resistance levels.
-
Short Term(20-50 days): the line of 20 days average has crossed 50 days of average upwards. this shows that price level crossed the resistance point and it can increase at close time.
-
Long Term(50-200 days): the lines are very far from them. the line of 50 days average is at the above. this shows that price level is higher than its monthly average in general. on long term, it may keep increasing.
OVERALL: GAIN/LOSS
> (We will use All Else Equals understanding for sections)
- The price gain/loss ratio graph is based on the $OP price from the Nov 18.
- With the starting of December, price level has started increasing.
- The price level is trying to reach its higher values in recent days, but there are dozens of ups and downs on price gain.
- We can take conclude that price level can unconsistent and can change rapidly.
OVERALL: VOLUME
> (We will use All Else Equals understanding for sections)
- We can clearly say that on the beginning of November, volumes of transactions have increased until the end of November. Also, we can say that it kept going consistent until the middle of December.
- Most of the people using Uniswap as first priority, then using Velodrome and finally Sushiswap.
- We can take a conclusion of there was a high amount of buy/sell volumes on the November’s beginning.
- The second conclusion is that this demand has started falling by the end of November.
OVERALL: RSI
> (We will use All Else Equals understanding for sections)
-
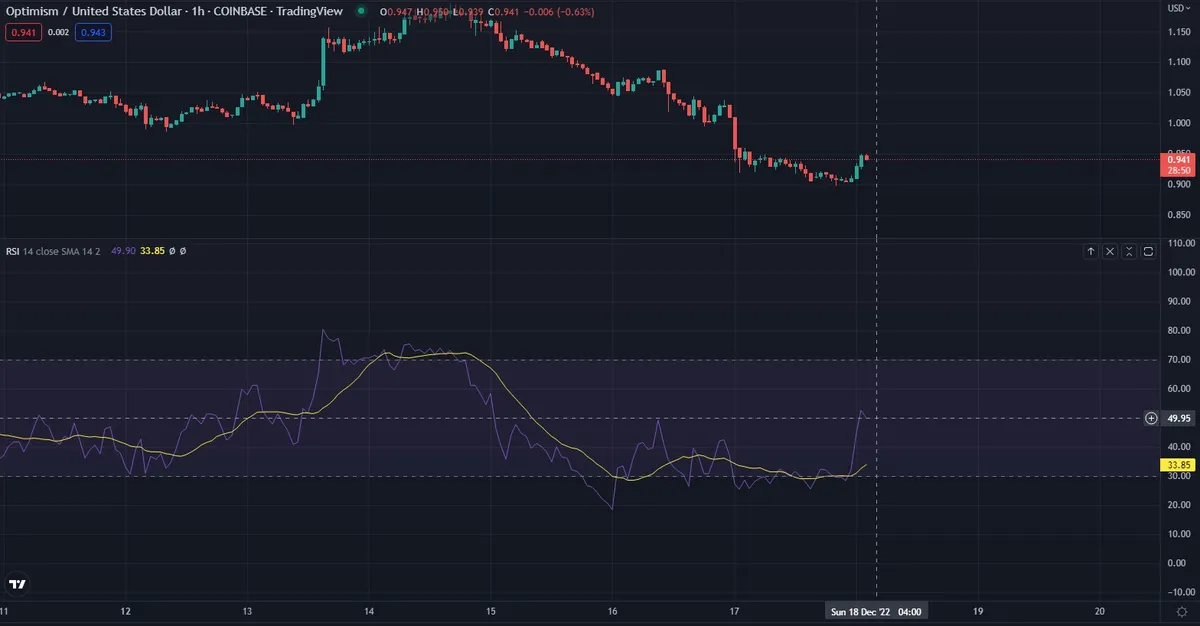
The RSI provides technical traders with signals about price momentum, and it is often plotted beneath the graph of an crypto asset’s price.
\ -
When RSI value is reach 30, this means there is an oversold situation and price of OP can change rapidly due to oversolding. Vice versa, this is true for RSI value is 70(overboughting situation).
\
-
On last days, there is an overbought on OP. This shows that the prices of OP can increase for a few days.
CONCLUSION
- Overall, most of the metrics are showing that: The event of FTX collapsing has effected most of the cryptocurrencies, also Optimism.
- The effects of collapse have started decreasing from the beginning of December and Optimism has started slightly increasing.
- Metrics’ are show that trend of OP prices probably will keep increasing.
LAST WORDS
Except from the extraordinary conditions(speculation of whales on environment, hacking events, etc.), OP prices will start increasing. Thanks for reading my dashboard!
Discord: panda#0742
Twitter:

ADDITIONAL NOTE
-
We will take the factors one by one, and assume that the only indicator for analyzing difference is that(All Else Equals)!
-
In the end of analysis, we will summarize our assumptions.
The Collapse of FTX
Cryptocurrency exchange FTX filed for Chapter 11(a form of bankruptcy that involves a reorganization of a debtor’s business affairs, debts, and assets) bankcruptcy protection on Nov. 11, 2022 after a swift fall from grace. The company's valuation plunged from $32 billion to bankruptcy in a matter of days, dragging down founder and CEO Sam Bankman-Fried's $16 billion net worth to near-zero.
FTX's collapse shook the volatile crypto market, which lost billions in value, dropping below $1 trillion. The consequences of FTX's rapid decline and collapse will likely impact cryptocurrencies well into the future and could even drag down broader markets.
\n
- Cryptocurrency exchange FTX collapsed in early November 2022 following a report by CoinDesk highlighting potential leverage and solvency concerns involving trading firm Alameda Research.
- FTX faced a liquidity crisis and a search for bailout funds; rival exchange Binance considered buying portions of the company but quickly backed out.
- By Nov. 11, FTX's CEO stepped down and the company filed for bankruptcy.
- In the hours following, FTX experienced a possible hack in which hundreds of millions worth of tokens were stolen.
\n
How Did FTX Fail?
FTX filed for bankruptcy on Nov. 11 after a surge of customer withdrawals earlier in the month. CEO Sam Bankman-Fried admitted that the company did not have sufficient assets in reserve to meet customer demand.