THORChain - $RUNE Flow
Chart the amount of daily + weekly volume of transferred $RUNE

Date: 2022-04-29
This analysis focuses on the flow of the $RUNE token.
All data is from between April 10th 2021 and April 29th 2022.

Looking at the weekly volumes of transferred $RUNE, I can see a few spikes, downs and nearly 0 volume.
- Week of June 14th, 2021 - spike
- Week of July 26th 2021 - 0 volume
- Week of October 25th, 2021 - spike
- Week of January 3rd, 2022 - spike
- High Volume starting in the week of February 28th, 2022
Let's have a look at the daily chart to get a better understanding ...
Taking a deeper look on the daily transfer volumes, I can see more clearly see that something is happening on certain days.
- Spike on June 15th, 2021
- Spike on June 21st, 2021
- Zero volume starting July 23rd till August 10th, 2021. Low volume comes back starting on August 10th.
- Spike on Oktober 26th, 2021
- Spike on November 3rd, 2021
- Huge Spike on January 3rd, 2022
- Higher volume starting in February 2022
- Spike on March 5th, 2022
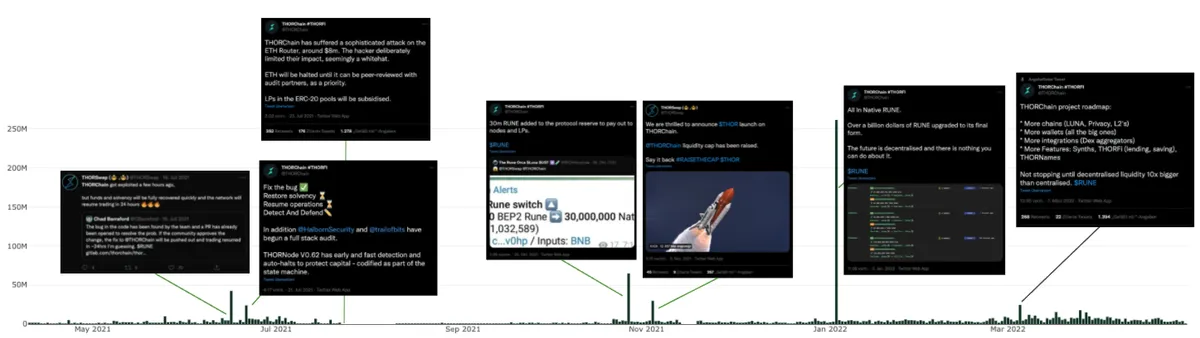
I will take a closer look at the days(events) where these 'things' happen and search the dates on twitter.
After some research on Twitter, I found out something about what happened on several dates:
- Spike on June 15th, 2021
- Spike on June 21th, 2021
- July 23rd, 2021: THORChain got hacked
- Low volume comes back starting on August 10th.
- Oktober 26th, 2021: 30m RUNE added to the protocol reserve
- Spike on November 3rd, 2021: $135m in liquidity committed to pools
- January 3rd, 2022: All In Native RUNE - RUNE converted to native $RUNE
- Higher volume starting in February 2022 *March 5th, 2022: More native chains integrated, Synths, THORFi
Source: Twitter

Thanks for reading!
This analysis was created on 2022–04–29 for a bounty at Flipside Crypto by piper to answer the following questions:
THORChain - $RUNE Flow: Chart the amount of daily + weekly volume of transferred $RUNE
All data used are from Flipside Crypto.

When I compare $RUNE Price Chart with Transfer Volume I can see that most events have an impact on price and volume. Here are two examples:
- Adding $RUNE to the protocol reserve and committing $135m to liquidity pools lead to a price increase!
- Integration of more native chains and introduction of Synths, THORFi etc. also lead to a volume and price increase!