Polygon Block Performance
This dashboard for sees the performance of the Polygon Block network in particularly by analysing the time between the blocks and then compare them with other networks such as Solana,Optimism etc...
INTRODUCTION
On Ethereum, the average block time between January 1 and 7, 2022, was 13.2 seconds, with about 188 transactions per block. During the same time period, Polygon had an average block time of 2.3 seconds and an average of 48 transactions per block. This indicates that Polygon was able to confirm 271 transactions on average in the same 13.2 seconds, which is 44 percent more transactions than the Ethereum network.
While the Polygon mempool functions nearly identically to the Ethereum mempool (with the sole exception of using a Proof-of-Stake consensus rather than a Proof-of-Work consensus), unconfirmed transactions are sitting in the Polygon mempool for much less time due to the faster and more efficient Polygon network.
On a single side chain, Polygon can process up to 65,000 transactions per second and has a block confirmation time of under two seconds. Aug 30, 2021

METHODOLOGY
Initially, the average count of the transactions, the number of blocks, the gas price used for transactions, and then the average blocks per second are also analyzed over time and it is charted to see the trend over time. Then the maximum time and the minimum time between the blocks of the polygon mainnet are calculated by giving a time frame of this year. This is followed by the comparison of the average time, minimum time, maximum time, and average transactions over time with all other networks such as Solana, Optimism, Arbitrum, and Flow. Now the block time difference in the polygon is charted over time. Now that we have all these, hence we go on checking the success and failed transactions in the polygon network and then compare them with the above-mentioned other networks. To wrap it up, we look at the average of the transactions and minimum-maximum time difference.
The left figure shows the blocks over time in the polygon network and it is charted over time and it is seen to maintain almost the same trend over the chosen period.
Now, towards the right displays the average blocks by accounting the same per each second as a time frame and it is charted over time.It even seems to be the same except the end is due to the delay in time that it could not calculate for the same day for calculation.
The right figure displays the transactions in the polygon network over time and it includes all the transactions and it is seen that the transactions also follow the trend to maintain the count if considering the average and June 13 faced the highest average of the transactions over time, Also considering 100% of transactions July 10 has made only 53 as an average of the transactions.
The GAS fee used for each transaction in the network is attributed here and is charted over time and it indicates that July 26 has collected the highest value as the gas fee for transactions though the average transaction is high on another day. The trend followed by the transactions is the same as if seen on the gas collected on July 10, where it collected less value than any other day even though some days managed to collect more gas even if the transactions are less.
Note that the average time between two blocks in the polygon network in minutes is 267.22 and the minimum goes to 0.
The colourful pie diagrams displays the maximum time that the polygon take between the blocks and it is compared with all other networks and it is seen that the polygon has less maximum time and which is an indication of the better performance of the polygon block and the blue pie diagram displays the minimum time and it is seen that the polygon holds the minimum as 0 and to compare the minimum time of all other networks cannot be estimated.
The chart here indicates the average value of the transactions and it compared with other networks it is seen that Solana has the highest valued transactions and polygon could make up to 4 % of the total value.
The average time over the different networks is charted here and it is indicated that the polygon has the highest average time of the transactions between blocks.
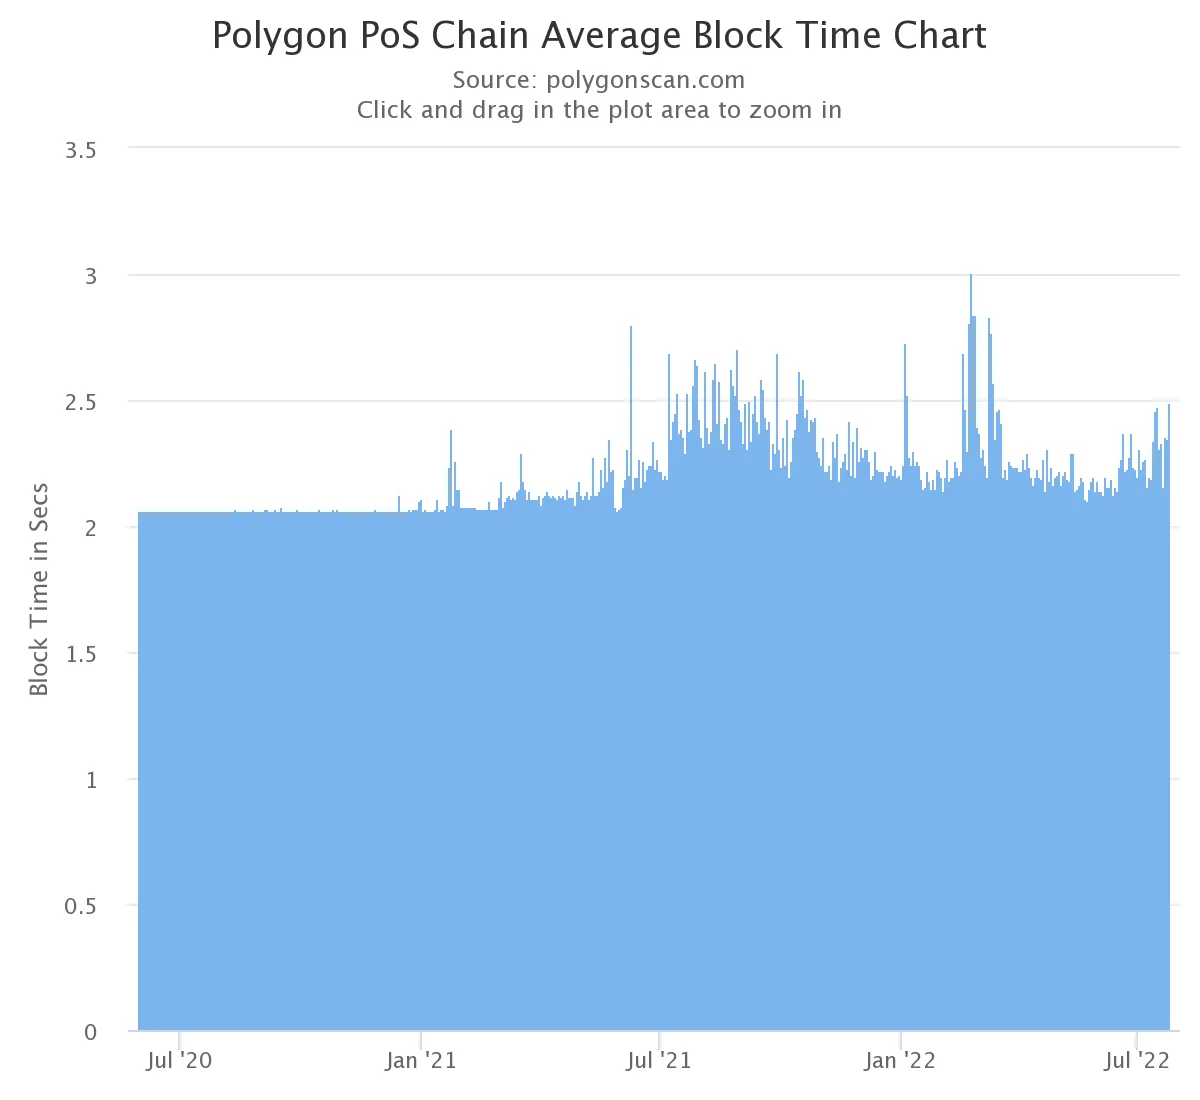
The time difference between different blocks is charted for here and it is indicates that June 25 has the highest average in the time difference of the transactions.This is calculated for the polygon network.
The chart in the right displays the transactions in the polygon network, particularly the failed and the successful ones and it is seen that the percentage of the failed transactions is the most less for ETH even though all have an average almost similar.
To wrap up with the polygon network analysis, the average transactions seems to be 77.23 and the average difference of time between the blocks seems to be 2.22 with a maximum difference of 8 and a minimum of 2.