Qustions
Q109. Liquidity providers stats
Evaluate the distribution of various target segments who provide liquidity (LP):
- What’s the total no. of unique LP providers?
- What’s the ratio between Yield farmers vs. LP Providers?
- What’s the average no. of LP positions opened by each unique wallet address
- What’s the ratio of liquidity (Based on TVL) owned by the Protocol vs. Retail LP in both LP Pool and yield farms
- The percentage (%) increase/decrease of LP Providers in Sushi over the last 1 year
Evaluate the profitability of an LP Provider & Yield Farmer
-
- Evaluate if there’s a correlation between profitability vs. length of time?
-
- Evaluate if there is a correlation between profit vs. time of withdrawal
-
- Correlation between profitability vs type of pool? EX: stable pool
Introduction
What is SushiSwap?
==SushiSwap== (SUSHI) is an ==Ethereum== token that powers ==SushiSwap==, a decentralized cryptocurrency exchange and automated market maker built on ==Ethereum. Holders of SUSHI can participate in community governance and stake their tokens to receive a portion of ==SushiSwap=='s transaction fees.
How does ==SushiSwap== make money?
Users receive ==SLP== tokens whenever they provide liquidity to ==SushiSwap== pools. You earn trading fees as a liquidity provider and can double up on these rewards by farming your ==SLP== tokens
**Source :: **

**twitter: **
**Docs: **
**Blog: **
Saving SushiSwap
==SushiSwap== has only gained traction since and moved on to become one of crypto==’s most popular ==DEXs==. More importantly, after such a rocky start, ==SushiSwap== has managed to evolve into a ==DeFi success story and is now one of the top DEXs that rakes in billions of dollars in liquidity volume.
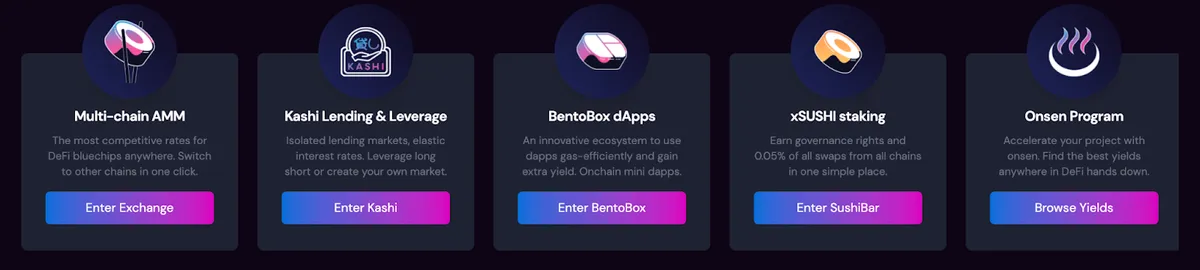
0xMaki and the team didn’t stop with ==SushiSwap==, however. They have continued building and adding to their Automated Market Maker (==AMM==), transforming it into the “Sushi” that it is today a veritable suite of ==DeFi== products of which ==SushiSwap== is now only one part.
Sushi has successfully developed an impressive product suite that not only includes their well-known SushiSwap== DEX but yield instruments, lending and margin trading, cross-chain implementations, ==NFT== exchanges, and derivative staking opportunities as well.
Source ::
analyze
Description
The above numbers are related to the first part of the question, the donations you see above are related to total on of uniqe Lp providers and total number of unique yield farmers and the ratio between yield farmers vc lp provider and avg number of lp positions by wallets and total pool and total user lp un sushi
the method
To get these data, tables and charts, I have used the tables in flipsid, as well as the addresses of important sushi contracts, in addition, I used the codes of one of the analysts to get ideas for coding.
> ORIGIN_TO_ADDRESS='0xd9e1ce17f2641f24ae83637ab66a2cca9c378b9f' > > and origin_function_signature in ('0xbaa2abde', '0x2195995c', '0x02751cec') > > from ethereum.core.ez_token_transfers > > from ethereum.core.dim_dex_liquidity_pools
Getting help and getting ideas from the codes :: ==MLD_ZMN
the result
According to the information and data that I have obtained, strange things have happened due to the fall of the ==crypto== market, and in the sushi section, there have been some things that have caused the creation of numbers.
Description
The first two pie charts show the ratio of liquidity owned by the protocols vs retail lp in lp pool and ratio of liquidity owned by the protocol vs retail lp yielded farms
The second two graphs show the number of lyeld farmers in sushi in the past year and the number of lp providers in sushi in the past year.
The above graphs are related to the last part of the question, which gives Sama enough information about each part, it is compared in terms of volume and percentage ratio.