Solana NFT Project Feature
What is Solana?
Solana is a highly functional open source project that implements a new, permissionless and high-speed layer-1 blockchain.
Created in 2017 by Anatoly Yakovenko, a former executive at Qualcomm, Solana aims to scale throughput beyond what is typically achieved by popular blockchains while keeping costs low. Solana implements an innovative hybrid consensus model that combines a unique proof-of-history (PoH) algorithm with the lightning-fast synchronization engine, which is a version of proof-of-stake (PoS). Because of this, the Solana network can theoretically process over 710,000 transactions per second (TPS) without any scaling solutions needed.
Solana’s third-generation blockchain architecture is designed to facilitate smart contracts and decentralized application (DApp) creation. The project supports an array of decentralized finance (DeFi) platforms as well as nonfungible token (NFT) marketplaces.
Solana blockchain was rolled out during the 2017 initial coin offering (ICO) boom. The project’s internal testnet was released in 2018, followed by multiple testnet phases leading to the eventual official launch of the main network in 2020.
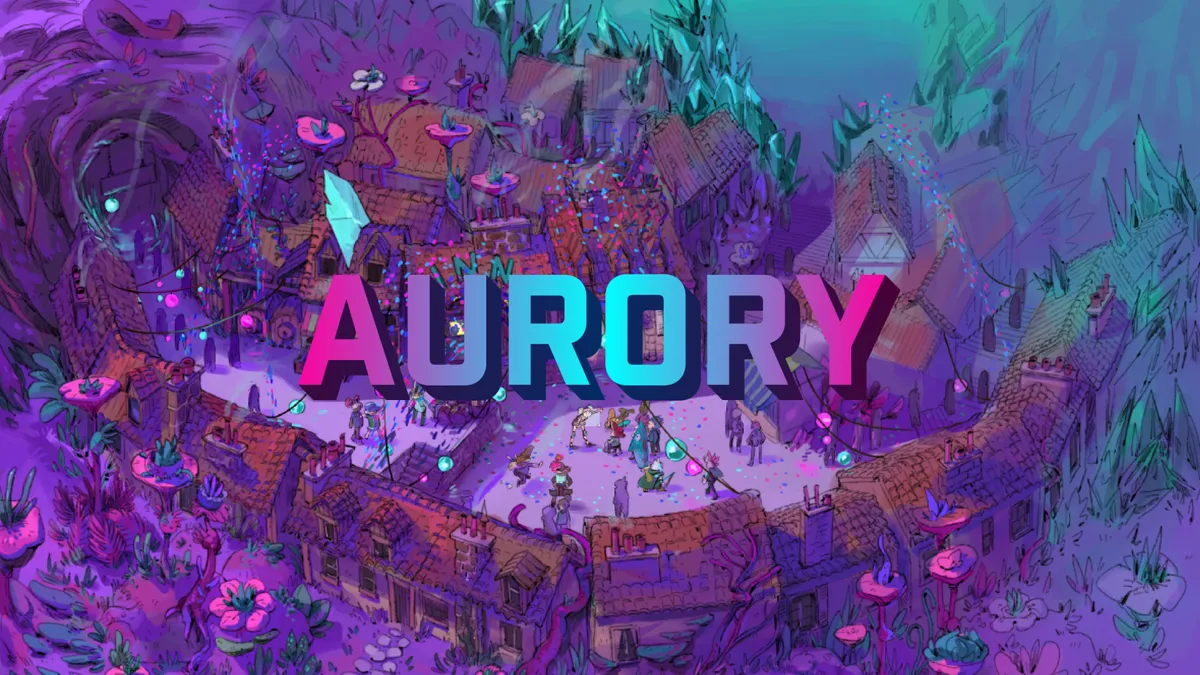
What is Aurory Solana?
Blockchain gaming project powered by Solana. Aurory is a play-to-earn desktop game where players are invited to explore a rich and diverse universe.
Aurory is a gaming studio first, and a crypto company second. Our team of industry veterans are here to bring the same AAA quality experience that we all love from web2, but with a dash of seamless web3 asset ownership enabled by low fees and quick transactions on Solana.
People will be able to stake the tokens they won on the platform in order to win additional tokens, but also they will be able to stake the NFTs cards they earned by defeating monsters in order to win in-game skins, unique and legendary cards, power-ups. All the items you win by staking NFTs will be usable in fights against other players but also will be tradable in our marketplace.
morr ::
qustion
Choose a NFT project from the following list and create a dashboard with the new Flipside dashboard layout that can refresh once a day highlighting at least 4 metrics of your choosing that helps show the "health" of the project. Note any noticeable trends or current events for the project. Highlight how liquidity is flowing in and out of the project and what types of buyers and sellers are interacting with the project.
the method
I have used the data in the following tables to obtain this data
((solana.core.dim_labels
solana.core.fact_nft_sales
SOLONA.DIM_NFT_METADATA))
\n
Description
The chart on the left shows the volume of purchases on a daily basis,
as you can see in the chart, the largest
volume of purchases was made on April 17, the volume of purchases on this day is 13.33k,
the lowest volume of purchases is for the day of July 1, the volume of purchases on this day It is the 36th day
Description
The chart on the left is a chart comparing the number of unique sales, and the total sales volume
As you can see in the graph, whenever the number of unique sales has increased, the volume has also increased, but in general, it has a downward erosive trend, so that there has been a decrease in recent days.
Description
The diagram on the left shows that the best selling price is higher than the floor price, which means that these nfts were bought above the market price, which is the floor price. As you can see, in some days the prices were very high, but this trend has decreased in recent days and has reached its lowest level.
Description
The chart and table above are related to the transactions of this collection, to what extent it belongs to which markets
As you can see, the most transactions are recorded in the magic eden2 market
The graph on the left is a comparison of the percentage of transactions belonging to each market where this collection is traded
As you can see in the graph on the left, the highest percentage belongs to:
Magic edenv2 :: 60.2%
solanart :: 23.8%
opensea :: 10.8%
magic eden v1 :: 5.09%
Result
According to the data I got related to this nft collection, at the beginning, the volume of buying and selling, the volume of liquidity in this collection had an upward trend, but after some time, this trend has decreased, the volume of buying and selling has decreased, and the volume of liquidity has also has decreased, one of the reasons that can be mentioned is the fall of the crypto market and the fear that dominates the market.