Exploring Bitcoin: Insights from Data Analysis and Trends
Bitcoin Halving Schedule
| Halving Count | Date | Block Height at Halving | Block Reward Before Halving (BTC per block) | Block Reward After Halving (BTC per block) |
|---|---|---|---|---|
| 1 | 2012-11-27 | 210,000 | 50 | 25 |
| 2 | 2016-07-09 | 420,000 | 25 | 12.5 |
| 3 | 2020-05-11 | 630,000 | 12.5 | 6.25 |
| 4 | 2024-05-04 | 840,000 | 6.25 | 3.125 |
| 5 | 2028 | 1,050,000 | 3.125 | 1.5625 |
| 6 | 2032 | 1,260,000 | 1.5625 | 0.78125 |
| 7 | 2036 | 1,470,000 | 0.78125 | 0.396025 |
The correlation between Bitcoin and other altcoins is not always positive or stable. One of the altcoins that has a significant correlation with Bitcoin is Binance Coin (BNB), the native token of the world's largest cryptocurrency exchange, Binance, in terms of trading volume.
Based on analysis, the correlation coefficient between Bitcoin and BNB was 0.73 until August 31, 2023. This means a strong positive relationship exists between these two digital currencies.
One recent rumor circulating in the crypto community suggests that Binance might be selling Bitcoin to support the price of BNB. However, there is no concrete evidence to support this claim.
But why is this rumor so significant? One reason could be the possibility of a black swan event, referring to an unpredictable and extreme event that could have a major impact on the market. Similar to events that affected Mt. Gox in 2014, Bitfinex in 2016, and FTx in 2019, causing significant drops in Bitcoin's price.
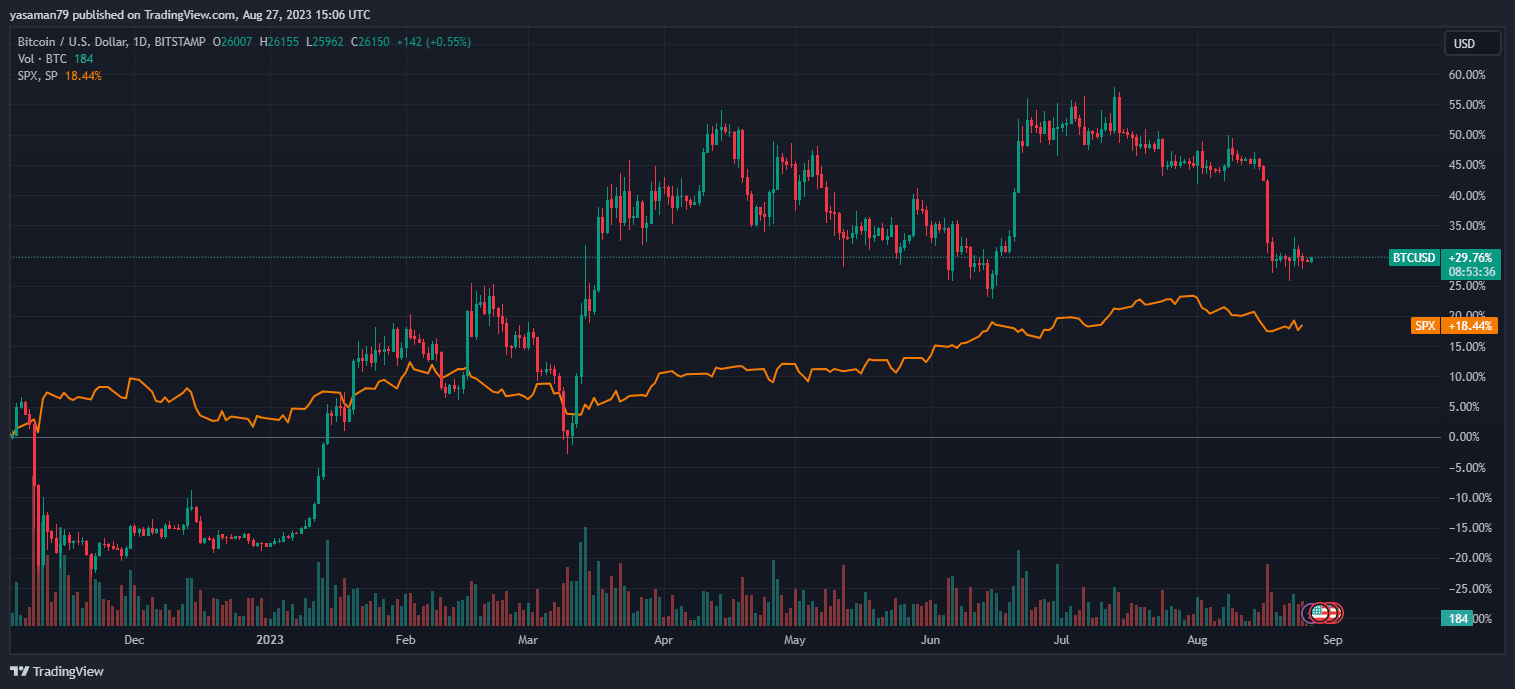
Another factor influencing Bitcoin's price is its correlation with the stock market, especially the S&P 500 index, which tracks the performance of 500 large companies listed on US exchanges. Additionally, the unemployment rate in the US can also have an impact due to a lack of liquidity for investment.
According to CoinMetrics, a cryptocurrency data provider, the correlation coefficient between Bitcoin and the S&P 500 was 0.08 until August 31, 2023. This indicates a weak positive relationship between these two assets, meaning they sometimes move in the same direction but not always.
However, this consideration should always be kept in mind for investors in both crypto and financial markets due to their shared interests.
Based on the chart , there appears to be little direct correlation between the price of Bitcoin and the number of transactions over time. The number of transactions per second (TPS) has generally increased over time, but with some fluctuations.
In the early years (2020-2021), there were large price increases that did not correspond with similar large TPS increases. For example, in late 2020 the price rose dramatically from around $10K to $30K+, while TPS stayed in the mid 20s. Periods of rapid TPS growth, like in early 2021 when TPS rose from ~25 to ~35, did generally correspond with price increases, but the relationship was not consistent. From mid 2021 onwards, TPS has stayed relatively steady in the 30s and 40s. During this period, the price has fluctuated significantly, reaching highs of $60K+ and dropping below $20K, while TPS stayed stable. So in the more recent years, there seems to be little correlation between TPS and price changes. This suggests TPS is not a major driver of Bitcoin's price. Overall, while TPS capacity has increased over time, enabling more transaction volume, the data does not point to TPS being a key determinant of Bitcoin's price. In addition Major Bitcoin network upgrades like SegWit in 2017 and Taproot in 2021 were designed to improve transaction efficiency and throughput.
- The halving schedule shows that the reward for mining a block of Bitcoin decreases by half every four years, which reduces the inflation rate and increases the scarcity of Bitcoin. The table also shows that the price of Bitcoin tends to increase after each halving event, which may indicate a positive correlation between the supply and demand of Bitcoin.
- The hash power by location shows that China has the highest share of the global Bitcoin mining power, followed by the USA and Canada. This may reflect the availability of cheap electricity, favorable regulations, and advanced hardware in these countries.
Based on the below chart , here are some key observations on how the block reward, difficulty and hash rate have changed over time for Bitcoin:
-
Block Reward: Was 50 BTC per block initially, reduced to 25 BTC in mid 2016, and 12.5 BTC in 2020. This follows the programmed halving that occurs every 210,000 blocks.
-
Difficulty: Has increased overall from 1 to over 500 billion. There are periodic adjustments up and down to maintain ~10 minute block times as hash rate changes.
-
Hash Rate: Has grown exponentially from less than 1 TH/s originally to 400-500 TH/s currently. Substantial growth reflects increasing mining activity and hardware improvements.
The steady drop in block reward combined with rising difficulty shows the designed deflationary supply schedule for bitcoin. More costly mining indicates greater security and network value. The large growth in hash rate over time shows increasing competition and investments in mining, suggesting a strong belief in Bitcoin's longevity. Periodic difficulty adjustments ensure mining rewards and security are maintained as hash rate varies. Overall, these metrics indicate the strength and resilience of the Bitcoin network - able to securely sustain itself over time per its original design.
Based on the above chart, which shows the year-over-year growth rate in percent for Bitcoin users by country from 2019-2023, we can make the following general observations:
-
Growth rates were positive for almost all countries in all years, indicating expanding Bitcoin adoption globally.
-
Growth rates were higher on average in earlier years (2019-2021) compared to 2022-2023, suggesting adoption is slowing as penetration increases.
-
The highest growth rates tend to be in developing countries like Nigeria, Kenya, Egypt, Morocco, India, Vietnam, etc. This indicates Bitcoin is seeing strong adoption in emerging markets.
-
More economically advanced countries like the US, UK, Germany, Japan have relatively lower growth rates, though still positive. This suggests Bitcoin adoption is more saturated in developed markets.
-
A few countries like China, Hong Kong, Czechia show declining user growth in later years, indicating possible saturation or regulatory headwinds.
-
By 2023, most countries are showing single digit growth, suggesting Bitcoin adoption is maturing and slowing in penetration growth.
So in summary, the data shows Bitcoin enjoyed rapid growth from 2019-2021 globally, with emerging markets outpacing advanced economies. But growth rates are slowing down by 2022-2023 as adoption spreads. Bitcoin appears to be transitioning from an early adoption phase to more mainstream integration in most countries.
Based on the above chart for Bitcoin whale counts and inventory over the last 2 months (July-August 2023):
There is a moderate positive correlation between the number of whales holding 100+ BTC and 1000+ BTC. The correlation coefficient is 0.53, indicating a moderately strong relationship. When the number of 100+ BTC whales increases, the number of 1000+ BTC whales also tends to increase. For example, on Aug 10 when there were 554 whales with 100+ BTC, there were also 21 whales with 1000+ BTC. However, the relationship is not perfect. On some days like Aug 6, the 100+ BTC whales decreased while the 1000+ whales increased. The inventory levels of both categories also tend to move in the same direction, but the correlation is weaker (0.42). This is likely because the 1000+ BTC whales hold a much higher total inventory. Over the last month, both whale group counts peaked around Aug 10 and then declined. This aligns with the drop in Bitcoin price seen in mid August.
Volatility is a measure that indicates how much the price of an asset changes over time. High volatility implies that the price is more unpredictable and riskier, while low volatility suggests that the price is more stable and predictable.
According to the chart, Bitcoin volatility has decreased over the past years, as illustrated in the graph below.
As you can see from the chart, Bitcoin's volatility has decreased from its peak in 2020 . This indicates that Bitcoin has matured as an asset class over time, becoming more mature and stable. This might be seen as positive by some and negative by others who had unrealistic expectations. However, it still exhibits much higher volatility compared to most traditional assets like stocks, bonds, gold, etc.
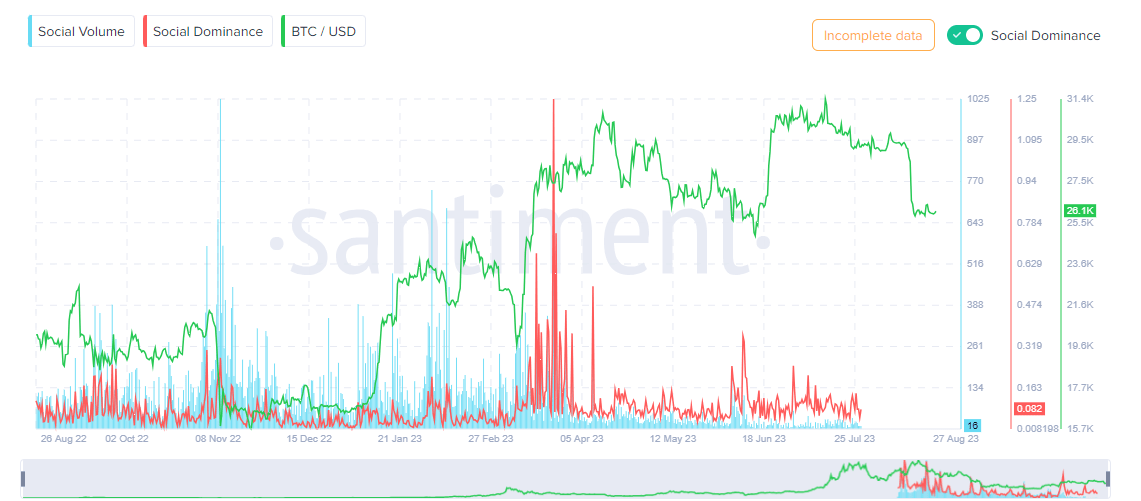
The photo shows a line graph that compares the social volume, social dominance, and price of Bitcoin (BTC) over time. The social volume is an indicator that measures the total number of social media text documents that contain keywords related to Bitcoin. The social dominance is the percentage of social media mentions of Bitcoin among all cryptocurrencies. The price of Bitcoin is the exchange rate of BTC to USD.
- The social volume and social dominance of Bitcoin tend to increase when there are significant events or news related to Bitcoin, such as price surges, regulatory changes, or technological innovations. For example, the peaks in social volume and social dominance in December 2020 and April 2021 correspond to the periods when Bitcoin reached new all-time highs.
- The social volume and social dominance of Bitcoin also tend to reflect the sentiment and interest of the crypto community and the general public. For example, the dips in social volume and social dominance in May 2021 and July 2021 correspond to the periods when Bitcoin experienced sharp price corrections and negative media coverage.
- The price of Bitcoin is influenced by many factors, such as supply and demand, market sentiment, innovation, regulation, and competition. The relationship between the price and the social metrics of Bitcoin is not always clear or consistent. Sometimes, the price may lead or lag behind the social metrics, or move in the opposite direction. For example, the price of Bitcoin reached a local peak in June 2021, while the social volume and social dominance reached a local trough. https://app.santiment.net/labs/trends/explore/buy%20AND%20(dip%20OR%20dips)?asset=bitcoin&from=2022-03-14T07%3A00%3A00.000Z&interval=3h&isCartesianGridActive=true&isSocialDominanceActive=true&isWatermarkLighter=false&isWatermarkVisible=true&slug=buy%20AND%20%28dip%20OR%20dips%29&ticker=BTC&timeRange=3m&to=2022-06-15T06%3A59%3A59.999Z
Welcome to the comprehensive dashboard providing insights into the dynamic world of cryptocurrency, specifically focusing on Bitcoin and its intricate relationships, market dynamics, and historical trends. Here, you'll find a wealth of information encompassing key correlations, market rumors, social sentiments, network metrics, and much more. Delve into the interplay between Bitcoin and altcoins, explore the impact of significant events on social activity, gain insights into network fundamentals, and grasp the evolving landscape of large holders and exchange flows. This dashboard is your gateway to understanding the multifaceted dimensions that shape the ever-evolving cryptocurrency ecosystem.
This data shows the number of Bitcoin whales (large holders) with balances of 100+ BTC and 1000+ BTC, along with their total holdings, over time from 2009 to 2023. Here's a brief analysis:
In the early years up to 2013, the number of whales and their holdings were quite low, in the hundreds or thousands of BTC. This reflects Bitcoin's limited adoption. From 2013 onward, both whale groups saw rapid growth, with 1000+ BTC whales exceeding 10,000 in number by 2017. Holdings reached the billions of USD. This indicates increasing institutional and investor interest in Bitcoin. Around 2018, regulations and falling prices correlated with declining whale numbers and holdings. But they rebounded by 2020. The last few years saw explosive growth in large holders and balances as adoption increased. Both whale groups reached all time highs in 2021, over 100K and 10K holders respectively. Currently in 2023, numbers have dropped but are still substantially higher than pre-2021 levels. This could suggest some stabilization of the Bitcoin whale population. The 1000+ BTC whales tend to have an outsized impact on total holdings compared to the smaller 100+ BTC group.
Based on the data provided showing monthly inflows and outflows of bitcoin to/from exchanges:
Focusing on the last 2 months (December 2022 and January 2023):
-
In December 2022, outflows were -874698 BTC and inflows were 781660 BTC. So net outflows were -93037 BTC.
-
In January 2023, outflows were -842260 BTC and inflows were 862892 BTC. So net inflows were +20632 BTC.
So in December there were net outflows from exchanges exceeding inflows. But in January this reversed and there were net inflows to exchanges.
This indicates in December there was overall more bitcoin being withdrawn from exchanges than deposited. But in January more bitcoin was being moved onto exchanges.
The outflow in December suggests bitcoin was moving into private wallets and cold storage. The inflow in January suggests more bitcoin was being traded or deposited for custody.
So in summary - December saw net outflows from exchanges while January saw net inflows. This points to a shift in behavior with more bitcoin withdrawals in December but deposits increasing again in the new year.
Based on the whale bitcoin balance changes over the past month provided:
The whale address that saw the biggest increase in its bitcoin balance is:
bc1qamgjuxaywqls56h7rg7afga3m6rgqwfkew688k
This address increased its balance by 1608.18833238 BTC over the month.
Some other whales that had large balance increases:
- 1G47mSr3oANXMafVrR8UC4pzV7FEAzo3r9: +8660.17656686 BTC
- 3ASsgp8AgppVvxYwnnHAUkFJq6cT2WymGn: +6579.69251727 BTC
- bc1q2f0tczgrukdxjrhhadpft2fehzpcrwrz549u90: +21816.70596166 BTC
- bc1qcdawhcz53fnd2xq0d88hl5vv4t9tuqd5muycsy: +25094.23482651 BTC
In contrast, some whales that had big declines in their balances:
- 1KNm4K8GUK8sMoxc2Z3zU8Uv5FDVjrA72p: -233901.34002835 BTC
- bc1qx2x5cqhymfcnjtg902ky6u5t5htmt7fvqztdsm028hkrvxcl4t2sjtpd9l: -124550.35539661 BTC
- 1Kr6QSydW9bFQG1mXiPNNu6WpJGmUa9i1g: -83056.64433972 BTC
So bc1qamgjuxaywqls56h7rg7afga3m6rgqwfkew688k saw the biggest increase in BTC balance over the month among these major whale addresses.
Based on the breakdown of Bitcoin inflows and outflows by exchange name:
Binance sees the largest flows by far, which is expected as the top crypto exchange. Both inflows and outflows are steadily in the hundreds of thousands of BTC per month. Net flows are relatively balanced. Bybit saw significant net outflows of -8849 BTC in August, indicating funds were withdrawn from the exchange that month. Crypto.com has seen increasing net inflows over the 3 month period, from -56 BTC in June to +3241 BTC in July and +310 BTC in August. This points to growing deposits into Crypto.com. Kucoin experienced net outflows in July and August, meaning more bitcoin was withdrawn than deposited those months. Outflows exceeded inflows by over 1000 BTC each month. Smaller exchanges like NBX, Phemex, and SwissBorg have relatively balanced flows, with net differences of less than 100 BTC per month. Newer exchange Woo Network saw net outflows in its first two months, potentially indicating user testing and withdrawal of deposited funds after signup.